Enterprise Flat Operational Dashboard
تفاصيل العمل
Overview
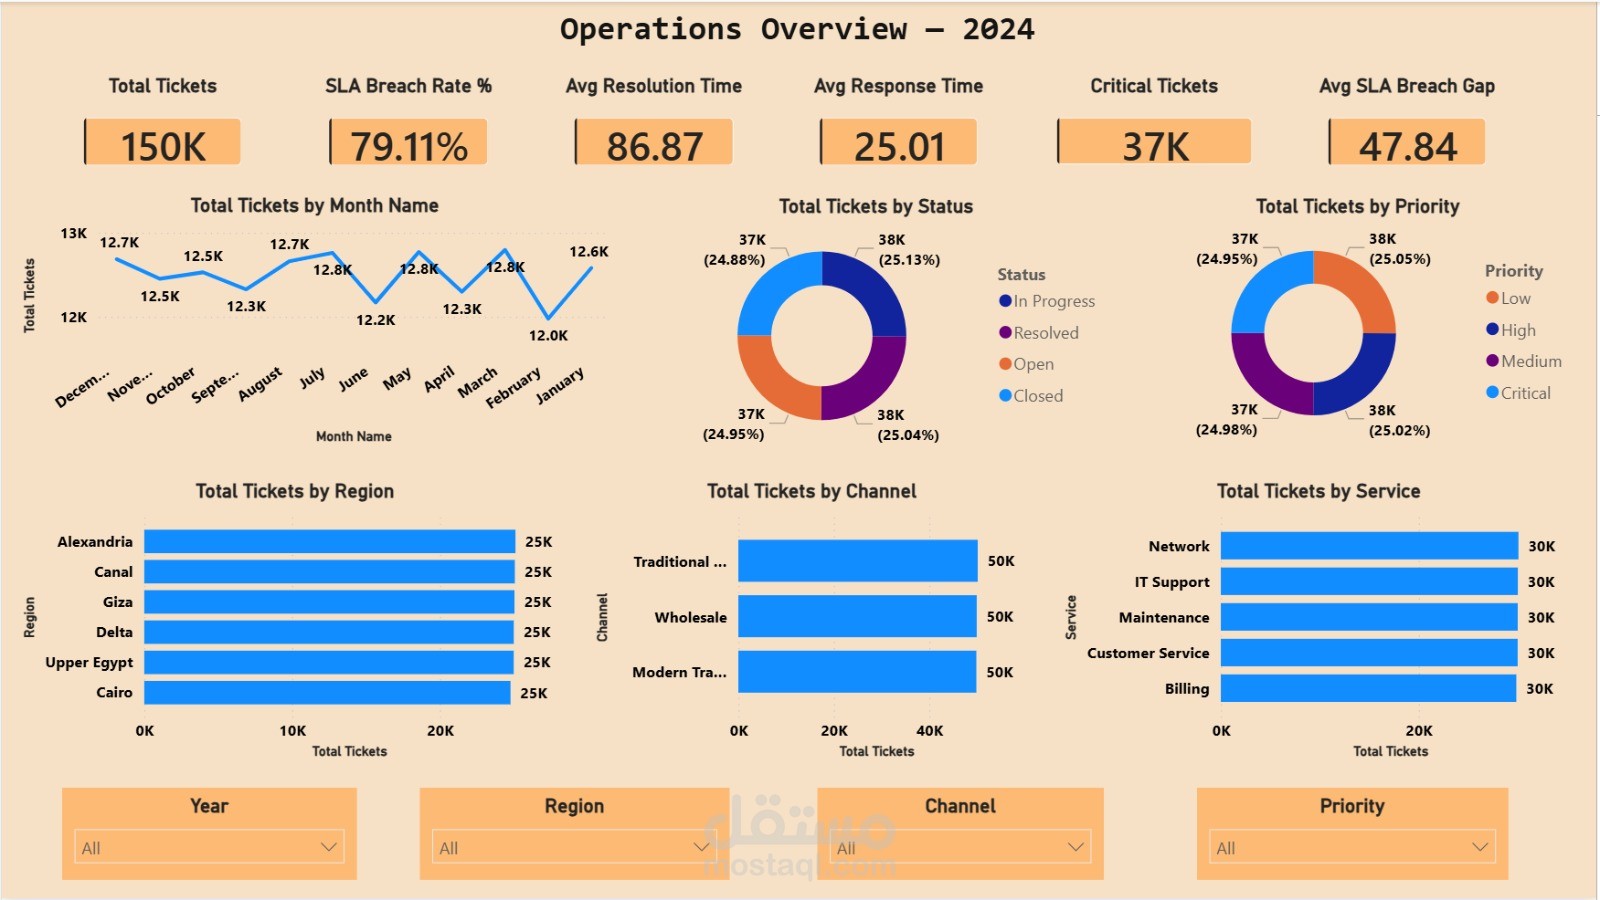
Power BI dashboard analyzing 150K support tickets across 6 regions in Egypt — focused on SLA performance, team efficiency, and operational insights.
Details
End-to-end data analysis project built on a 150,000-row enterprise operational dataset covering a full year (2024). The project includes data preparation in Power Query, 17 custom DAX measures, and a 3-page interactive Power BI dashboard covering Operations Overview, SLA Performance, and Team Performance Analysis.
Challenge
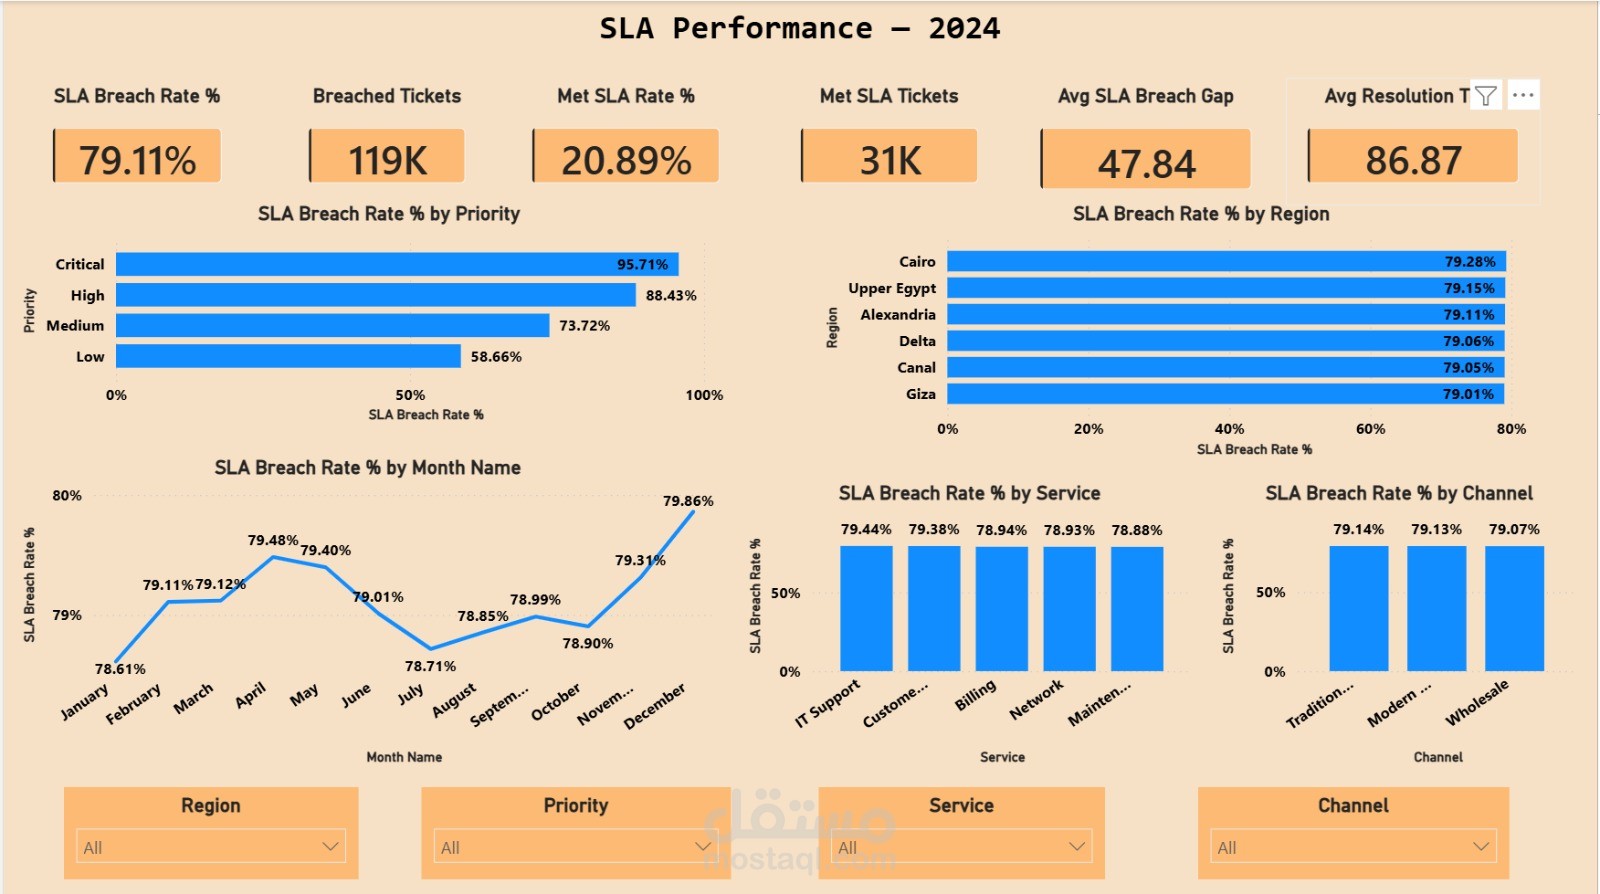
79% of support tickets were breaching SLA targets, with Critical priority tickets reaching a 95.71% breach rate. The business needed to identify whether this was a people, regional, or systemic issue.
Solution
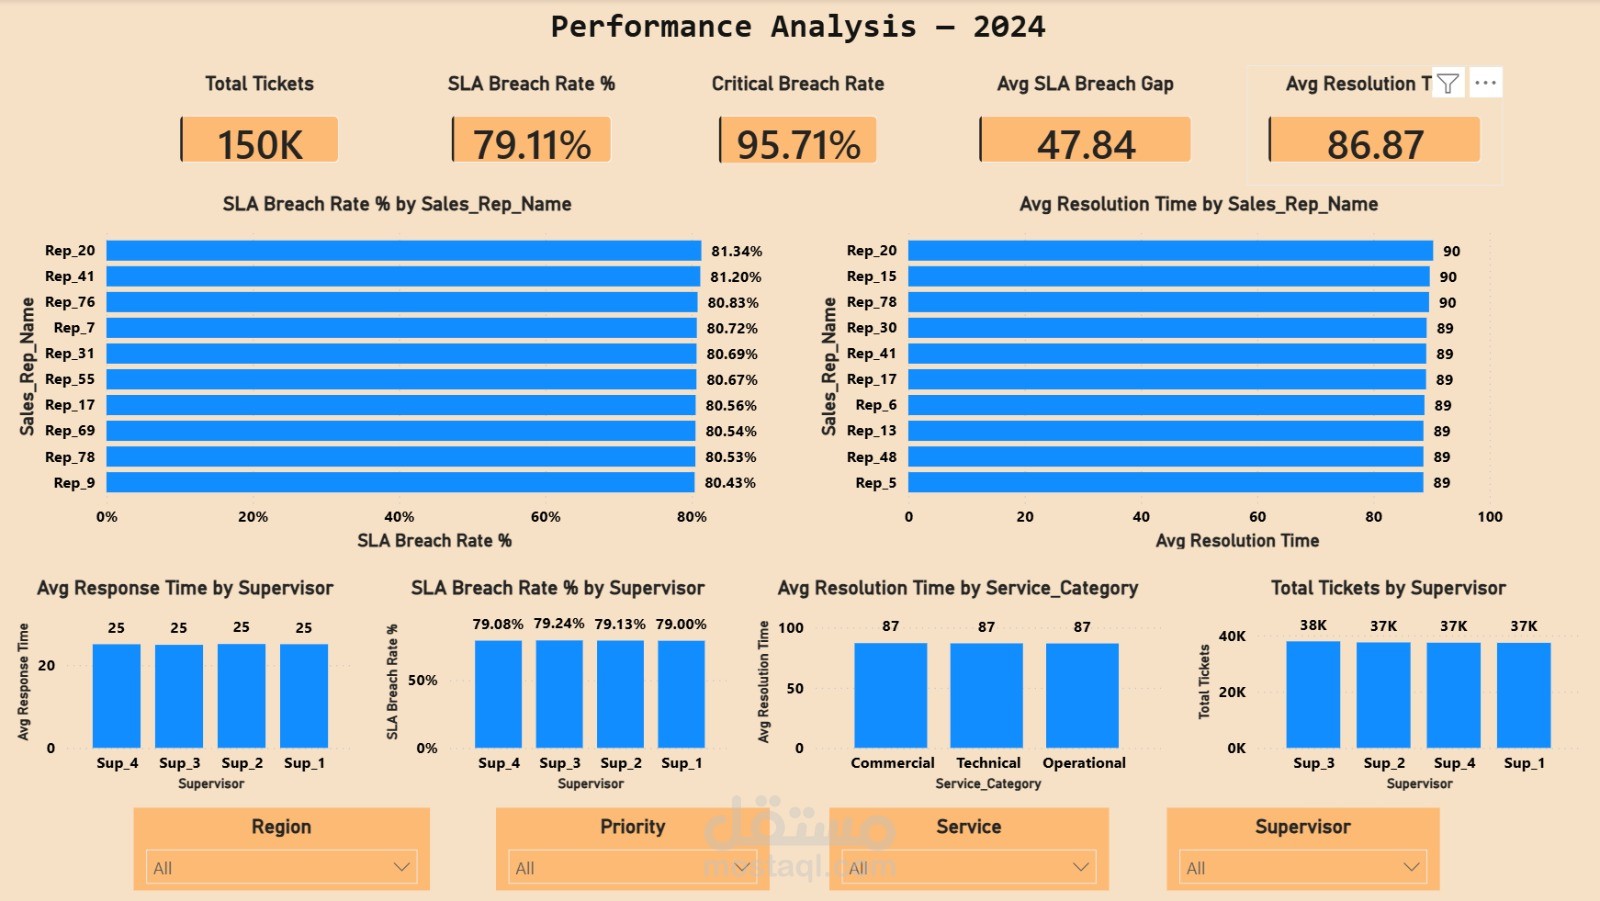
Built a structured Power BI dashboard with drill-down capabilities across priority, region, channel, service type, and individual sales reps. Created a custom SLA_Breached column and 17 DAX measures to quantify breach rates, resolution gaps, and team performance at every level.
Results
Identified that the SLA breach issue is 100% systemic — all 6 regions, 3 channels, 4 supervisors, and 100 reps show near-identical breach rates (~79%), pointing directly to a process-level problem rather than individual performance. Critical tickets average 47.84 hours over SLA target.