Student Performance & Dropout Risk Analysis — Pro Bono School Project
تفاصيل العمل
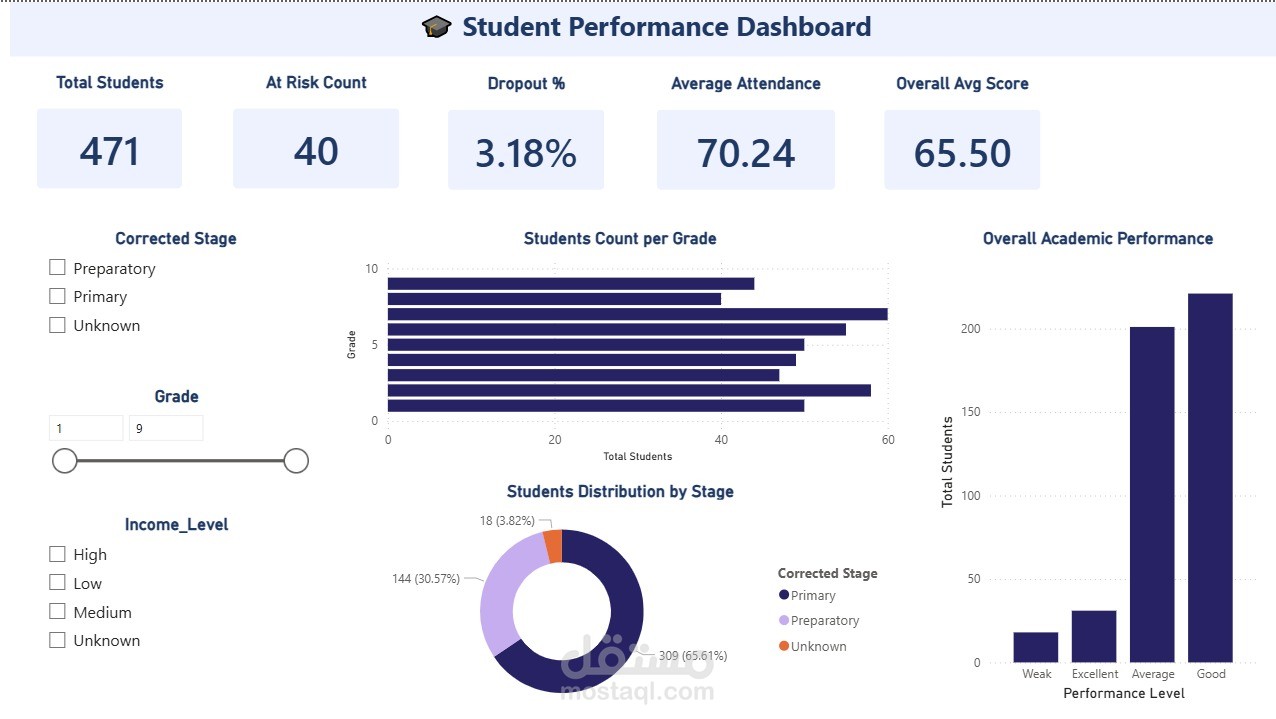

Overview
Volunteered as a Data Analyst for a local school in my village.
With approval from the school administration, I collected the data myself — from archives, student and teacher interviews, and behavioral observations.
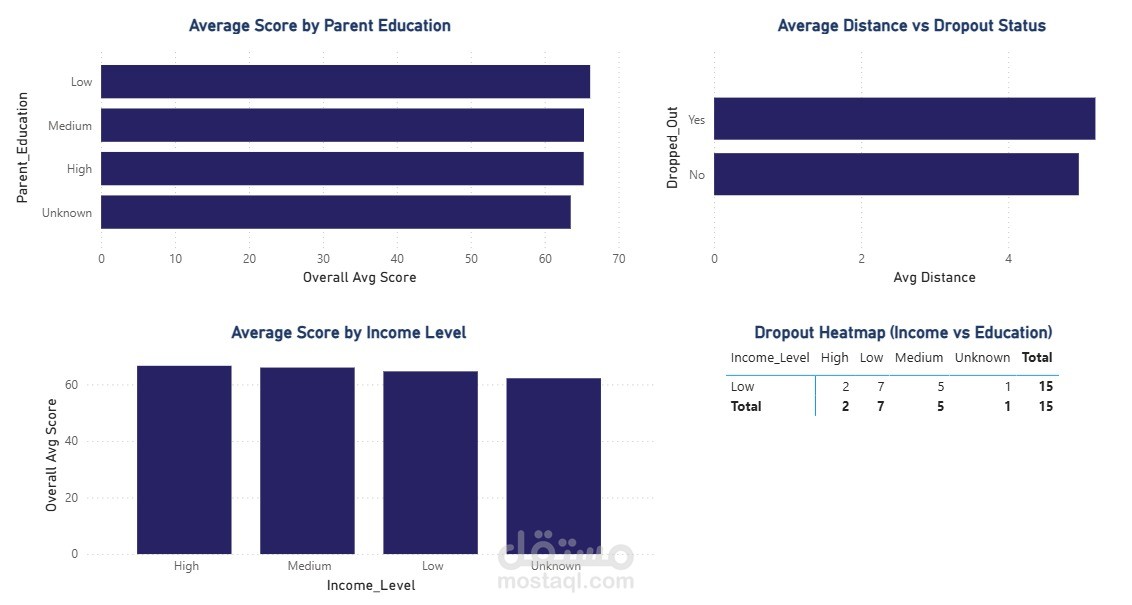
After building a Power BI dashboard, I discovered that **100% of dropouts were from low-income families.**
I intentionally kept the dashboard simple and easy to understand to help decision-makers take action.
Because data only matters when people can actually use it.
Details
As a data analytics student, I chose to apply my skills where they matter most — not on a practice dataset, but for a real school in my hometown village in Kafr El-Sheikh. I reached out to the school administration, proposed a free analytics initiative, and they welcomed the idea with full cooperation.
I visited the school in person, gathered raw data from administrative staff and student records across 500 entries and 20 columns, and took full ownership of the project from data collection to final delivery — completely pro bono. This is my way of giving back: the education I pursued didn't just benefit me, it found its purpose in serving my community.
Challenge
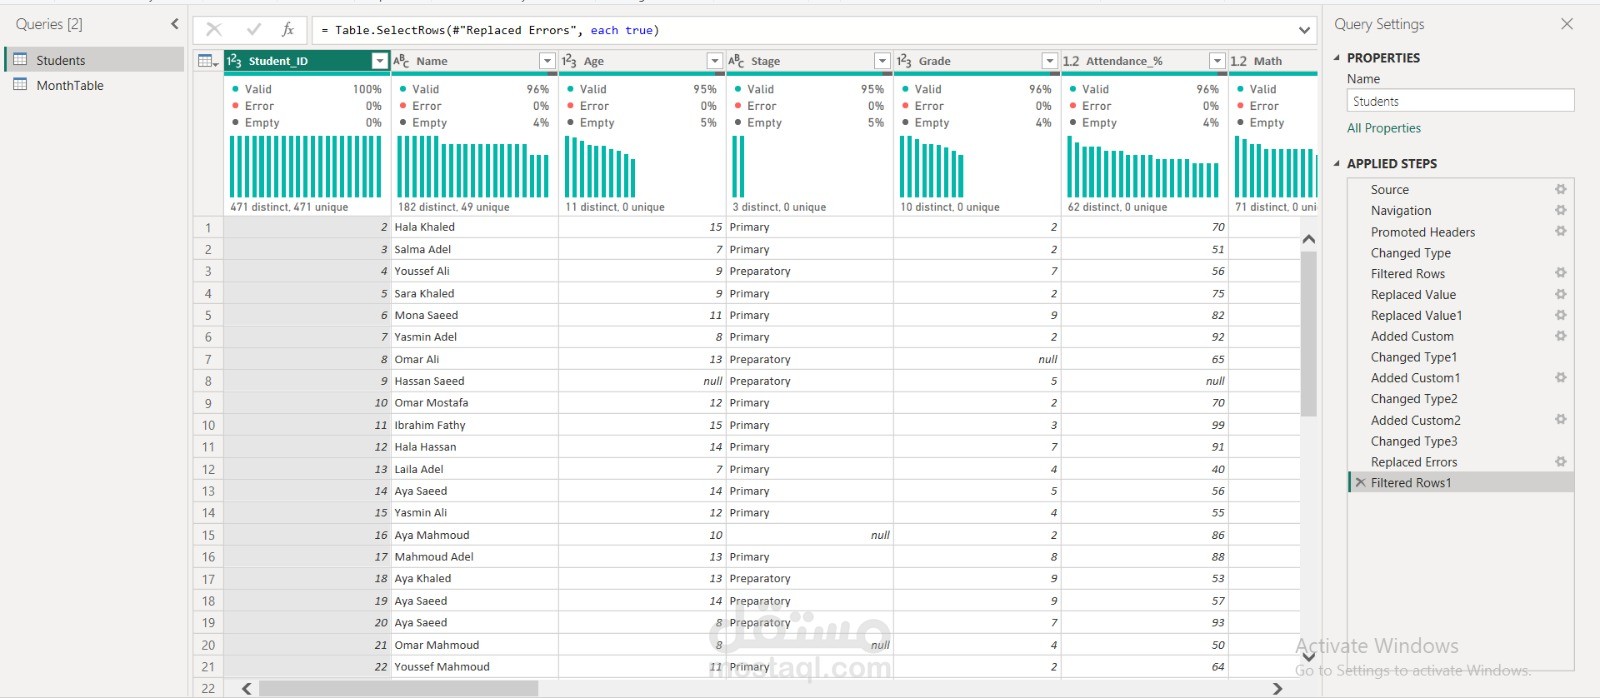
The school had no structured way to understand why students were dropping out or how to identify at-risk students early. Raw data was riddled with issues: missing values stored as asterisks instead of nulls, 29 ghost students with no ID inflating all percentages, missing subject scores being treated as zeros (collapsing student averages unfairly), and a corrupted Stage column requiring full re-derivation from the Grade column. Leadership was making decisions based on assumptions — like blaming student distance from school — with no data to confirm or deny them.
Solution
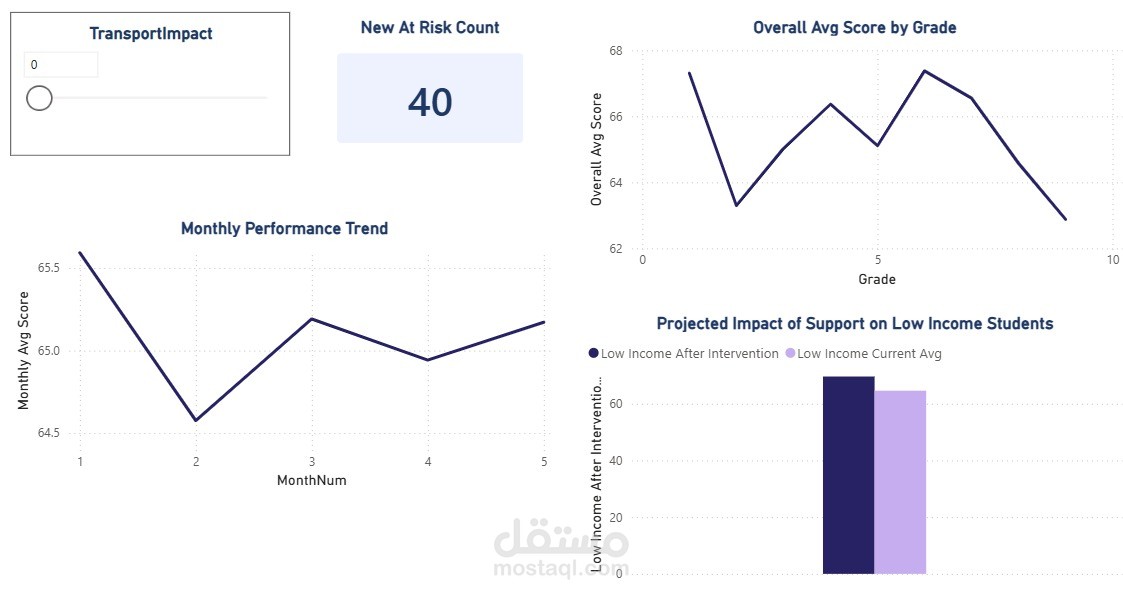
Built a complete end-to-end Power BI solution using Power Query for deep data cleaning and DAX for all calculated measures. Designed a 4-page dashboard covering: school-wide KPIs, dropout pattern analysis (scatter plot of attendance × score), socioeconomic factor breakdown (income, parent education, distance), and a trend + What-If simulation page with interactive sliders so leadership could model intervention scenarios. Answered 12 specific strategic questions requested by school management.
Results
Delivered a clear, evidence-based picture the school had never seen before. Key finding: 100% of the 17 dropout students belonged to low-income families — income was the decisive variable, not geography (distance difference between dropouts and non-dropouts was only 0.2 km). Monthly performance scores were completely flat across 5 months (64.5–65.5), confirming systemic stagnation. Recommended redirecting budget toward direct family support, launching targeted intervention for Grade 2 and Grade 9 students (highest dropout risk), and restructuring teaching methods to break the performance plateau. Findings were presented to school management with actionable next steps.