Patient Appointment Attendance
تفاصيل العمل
Patient Appointment Attendance Analysis 🏥🗓️
Project Overview
This project analyzes a dataset of over 100,000 medical appointments to understand why patients miss their scheduled visits. By examining factors such as age, gender, chronic conditions (Hypertension, Diabetes), and the "waiting period" between scheduling and the actual appointment, the analysis identifies key trends that contribute to "No-Show" rates.
Project Workflow
The repository demonstrates a full data analysis cycle:
Raw Data (Data Before Cleaning): The original dataset containing patient IDs, appointment details, and boolean flags for health conditions and attendance.
Processed Data (Data After Cleaning): The refined dataset featuring engineered columns such as:
Age Groups: Categorizing patients into Child, Adult, and Old.
Temporal Features: Extraction of 'Day Name' and 'Day Type' (Weekday vs. Weekend).
Standardized Flags: Converting boolean values to readable 'Yes/No' formats.
Core Metrics (Measures): Statistical insights including:
Attendance Rate: Calculating the overall show-up percentage (~79.7%).
No-Show Analysis: Identifying that ~20.3% of appointments are missed.
Waiting Time: Analyzing the average lead time (~10.1 days) and its impact on attendance.
Demographic Breakdown: Attendance counts by age group and neighborhood (e.g., Jardim Camburi as a high-volume area).
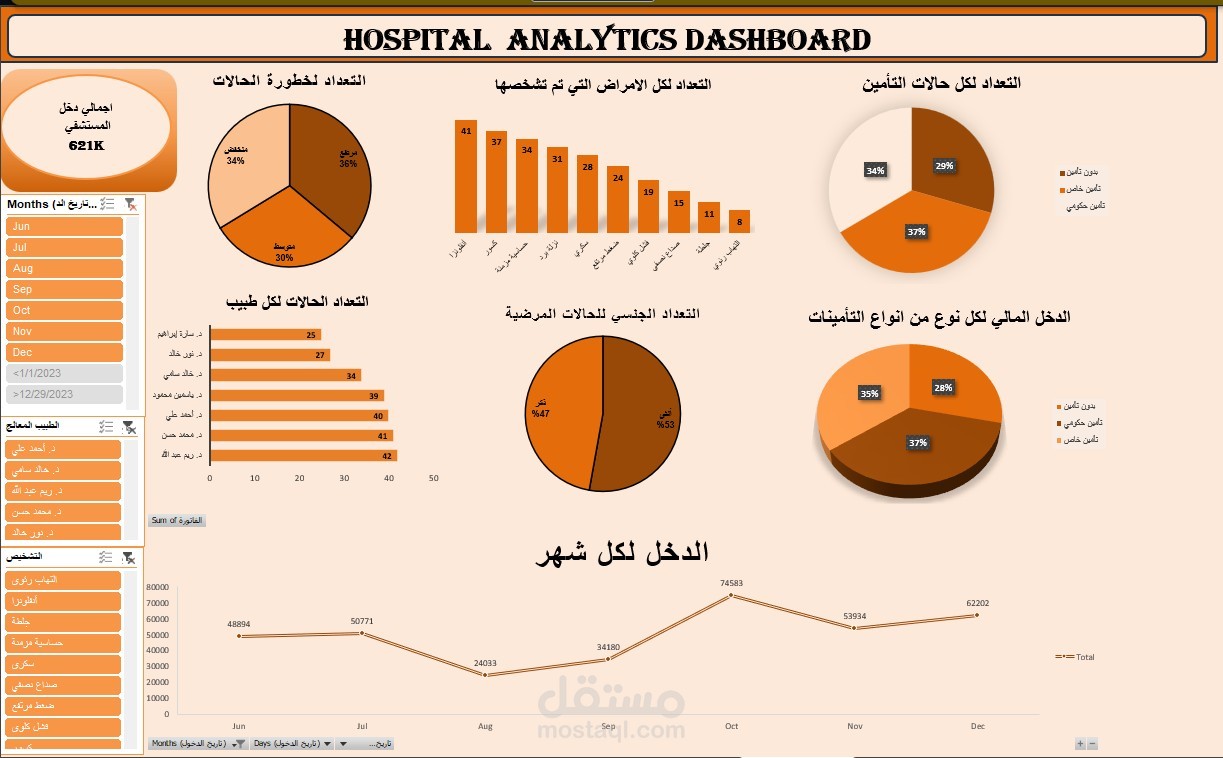
Attendance Dashboard (DashBoard): A visual summary of the KPIs used to track clinic performance and patient behavior.
Key Insights Analyzed
Lead Time Impact: Investigating if longer waiting periods between the booking date and appointment date increase the likelihood of a no-show.
Socio-Health Factors: Analyzing if patients with chronic conditions or those receiving welfare (Scholarship) have different attendance patterns.
Communication Effectiveness: Measuring the correlation between receiving an SMS reminder and actually showing up for the appointment.
Temporal Trends: Comparing attendance rates on weekdays versus weekends.
Tools Used
Microsoft Excel: For data cleaning, feature engineering, and pivot table reporting.
Statistical Aggregation: Used for calculating the "No-Show %" and "Average Waiting Days."