Maven Market Analysis
تفاصيل العمل
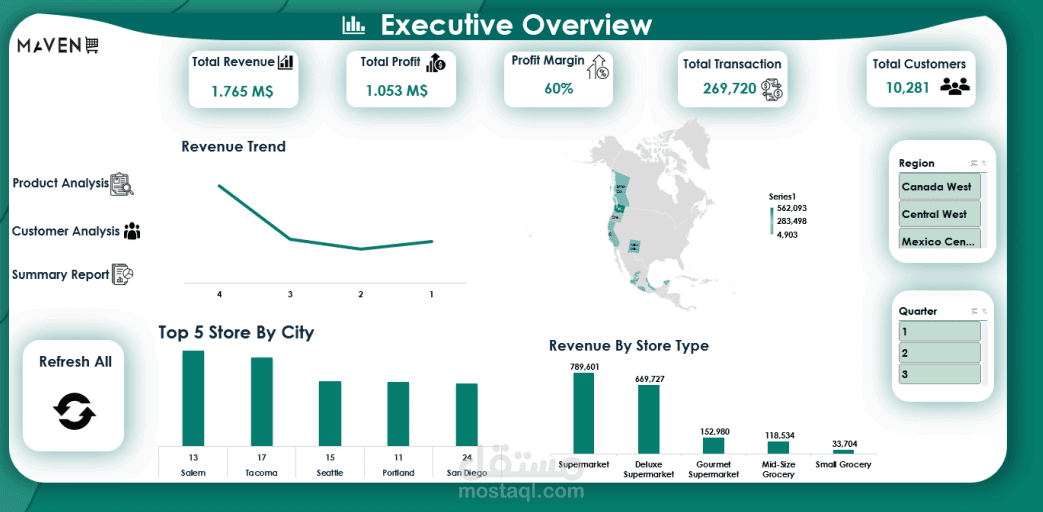
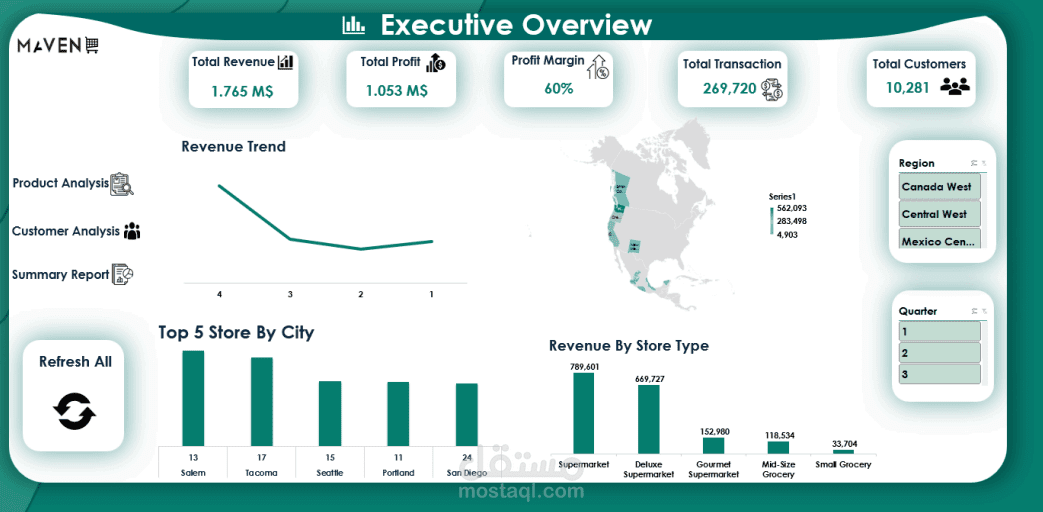
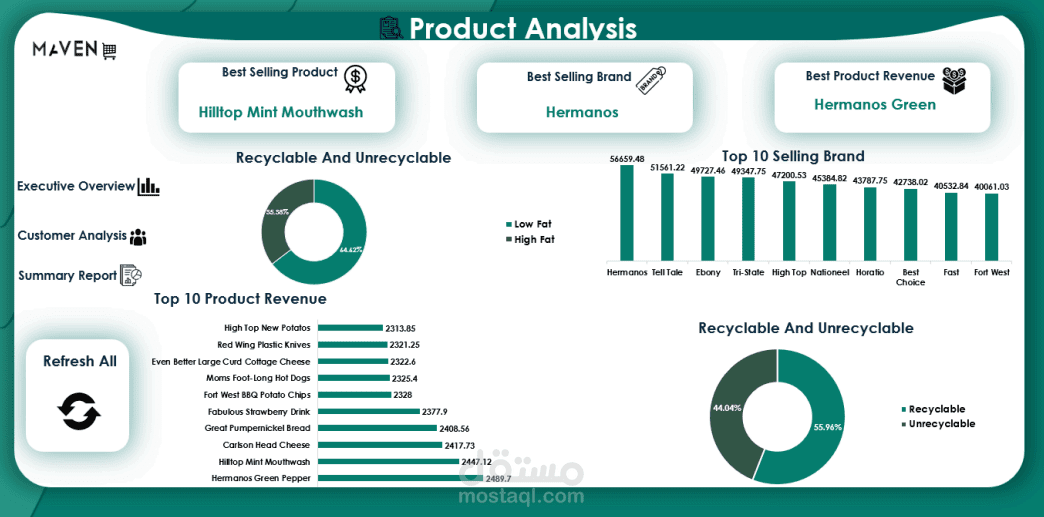
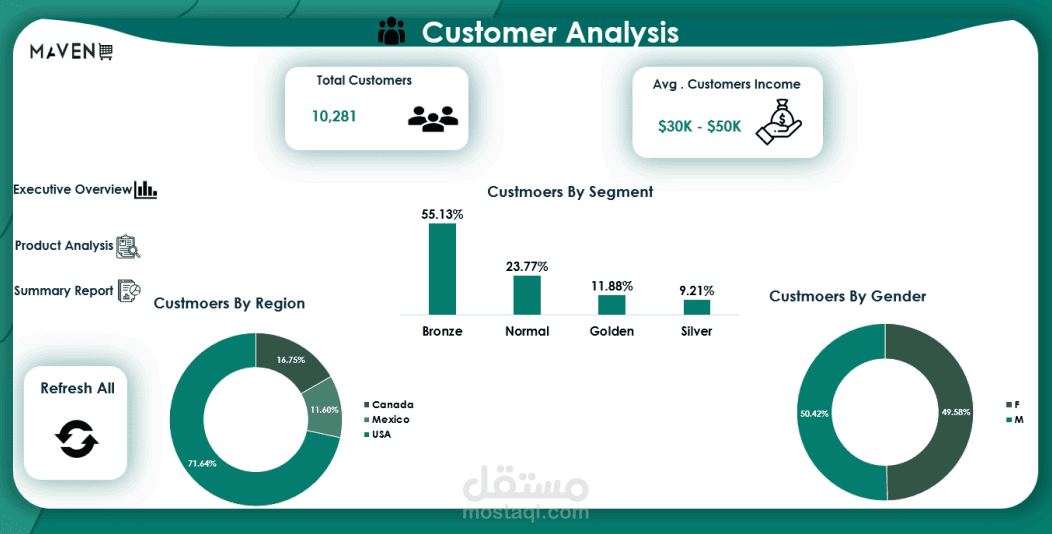
🔹 Project Components:
• Executive Overview Dashboard
• Product Analysis Dashboard
• Customer Analysis Dashboard
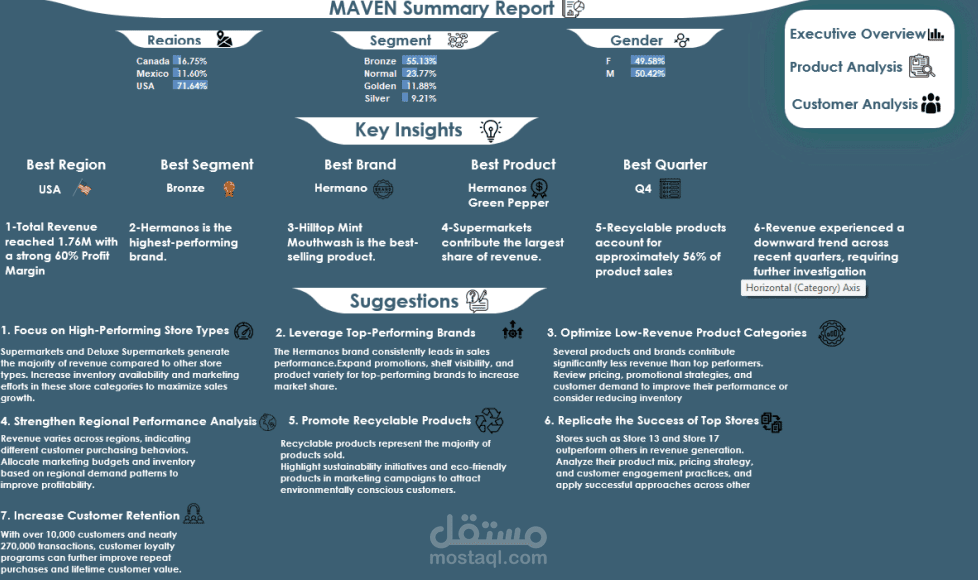
• Interactive Business Report
All dashboards and reports are fully connected, allowing users to navigate seamlessly across different business perspectives and drill down into key insights.
🛠 Skills & Tools Applied:
✅ Problem Exploration & Business Understanding
✅ Data Cleaning & Transformation using Power Query
✅ Data Modeling (Snowflake Schema)
✅ Power Pivot & DAX Measures
✅ Pivot Tables
✅ Slicers & Timelines
✅ Dashboard Wireframing
✅ Interactive Dashboard Development
✅ Business Recommendations & Reporting
📊 Key Outcomes:
• Analyzed sales performance across stores, products, and regions.
• Identified top-performing brands and stores.
• Evaluated customer behavior and purchasing patterns.
• Generated business recommendations to support data-driven decisions.
This project strengthened my ability to build end-to-end analytics solutions, from data preparation and modeling to visualization and business storytelling.