Bank Masr
تفاصيل العمل
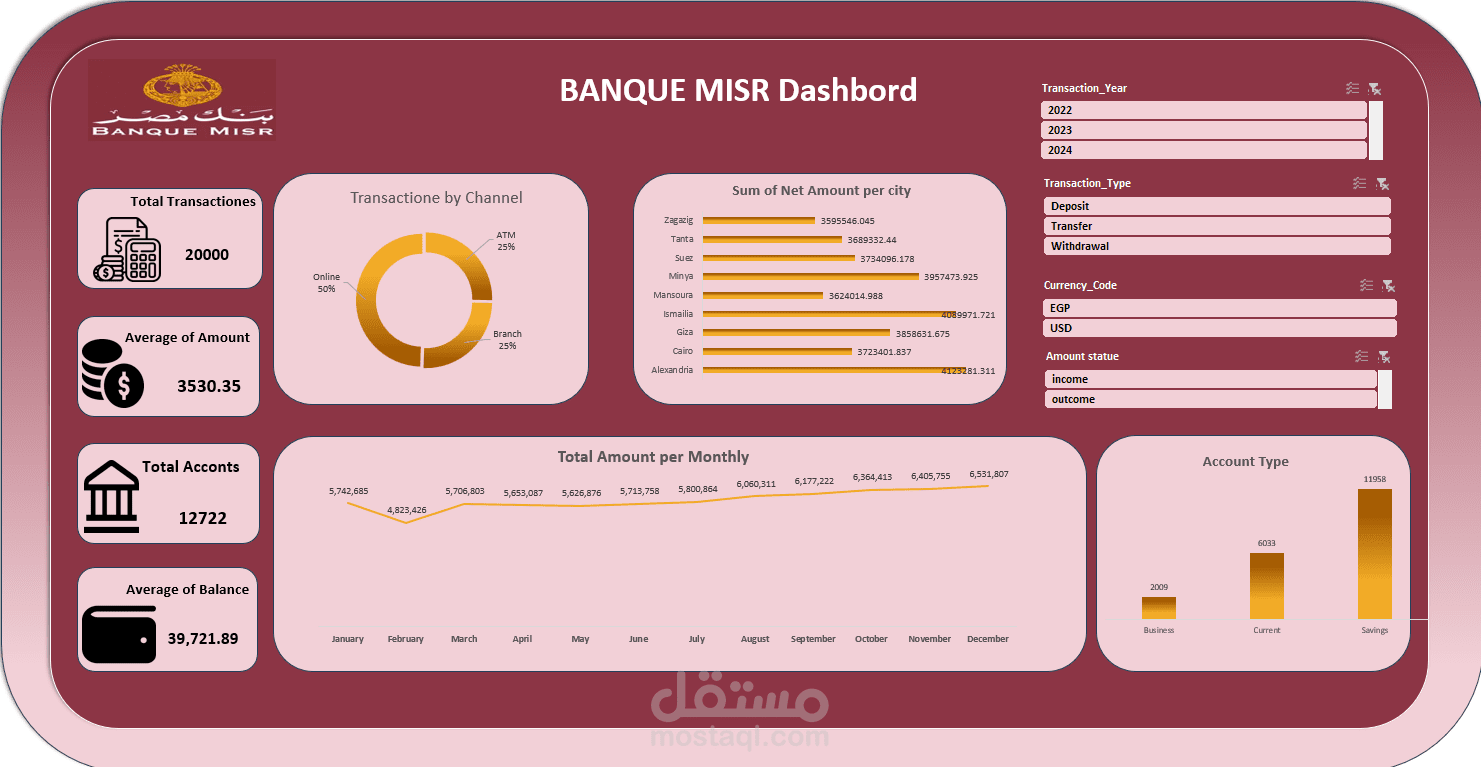
Designed and developed an interactive banking dashboard in Microsoft Excel to analyze 20,000 banking transactions and customer records. Conducted data cleaning, validation, and transformation to ensure data accuracy and consistency before building analytical reports.
Project Highlights:
Analyzed 20,000 transaction records across multiple banking channels.
Built KPI cards to track Total Transactions, Average Transaction Amount, and Average Customer Balance.
Identified transaction distribution across Online, ATM, Branch, and Mobile channels.
Analyzed Net Transaction Amount across different cities to compare regional banking activity.
Created monthly trend analysis to monitor transaction performance over time.
Evaluated account type distribution across Savings, Current, and Business accounts.
Implemented interactive slicers for dynamic filtering by Transaction Year and Transaction Type.
Tools & Skills:
Microsoft Excel
Pivot Tables & Pivot Charts
Data Cleaning
Data Validation
KPI Development
Data Visualization
Dashboard Design
Business Analysis
Outcome:
Delivered an interactive dashboard that transforms raw banking data into actionable insights, enabling efficient monitoring of customer activity, transaction behavior, and account performance.