Fawry Transactions
تفاصيل العمل
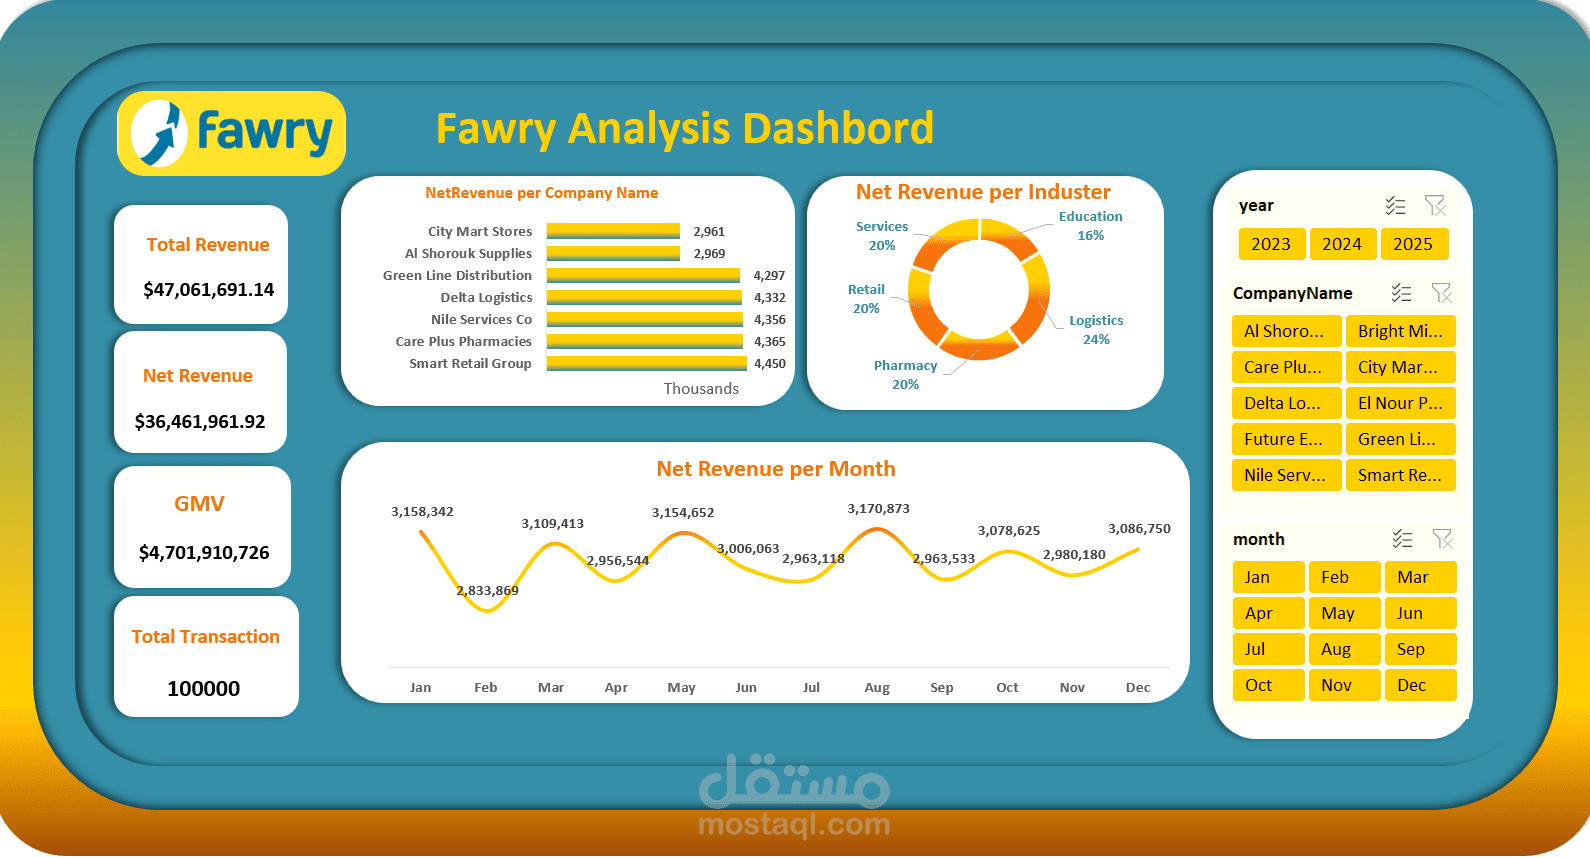
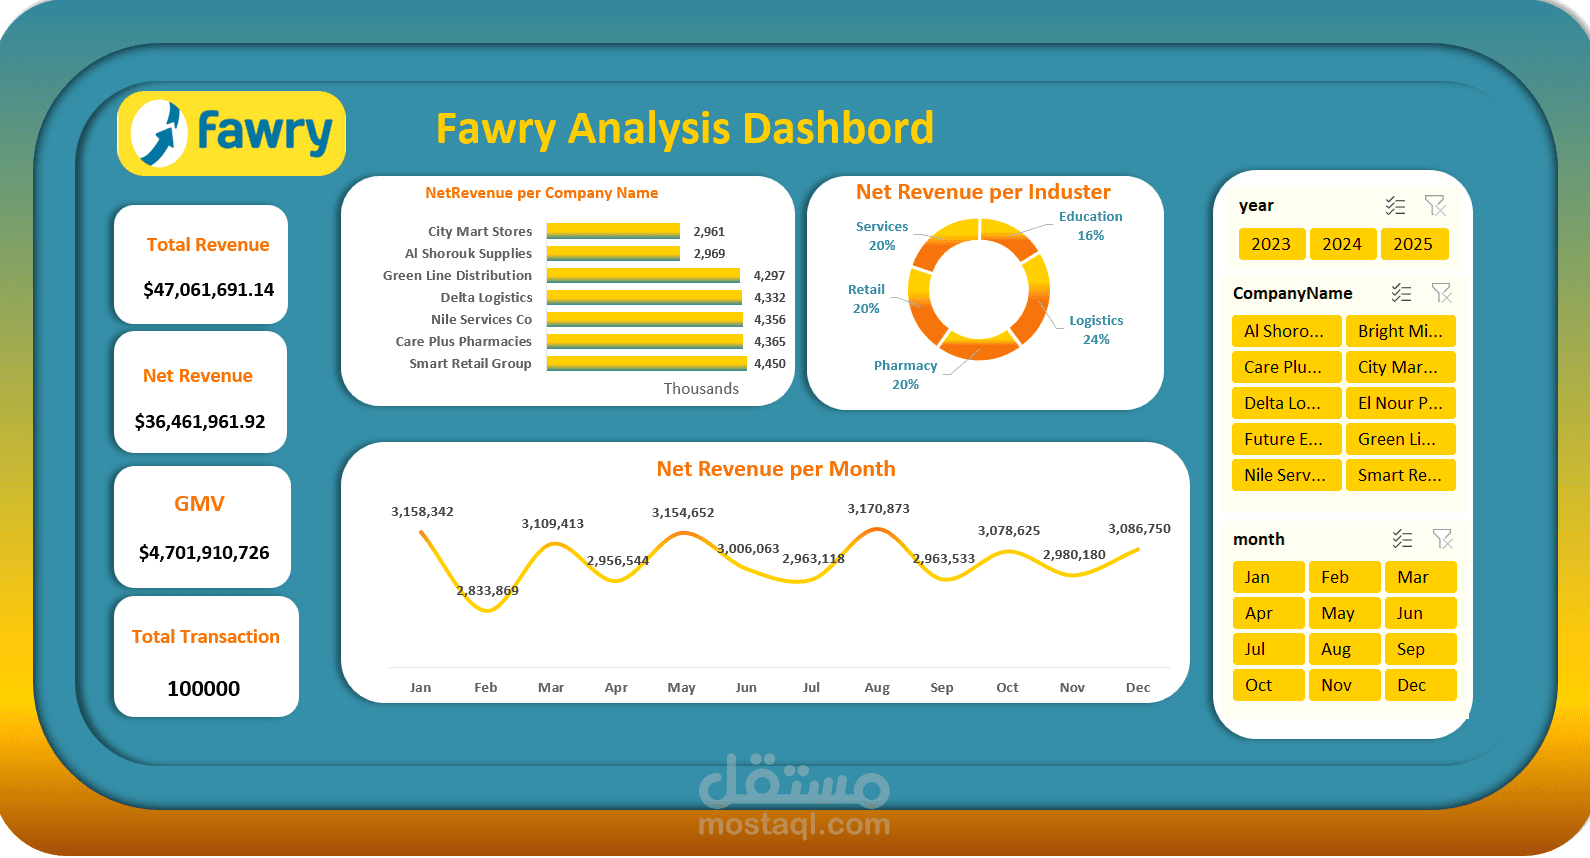
• Developed an interactive dashboard to analyze 100,000 transactions, tracking GMV, Total Revenue, and Net Revenue across multiple companies, industries, and time periods.
• Tools: Microsoft Excel, Pivot Tables, Pivot Charts, Slicers, KPI Cards, and Data Cleaning techniques to transform transactional data into actionable business insights.
• Outcome: Analyzed revenue trends by month, company, and industry, enabling performance monitoring and supporting data-driven business decisions.