Town Team sales Dashboard
تفاصيل العمل
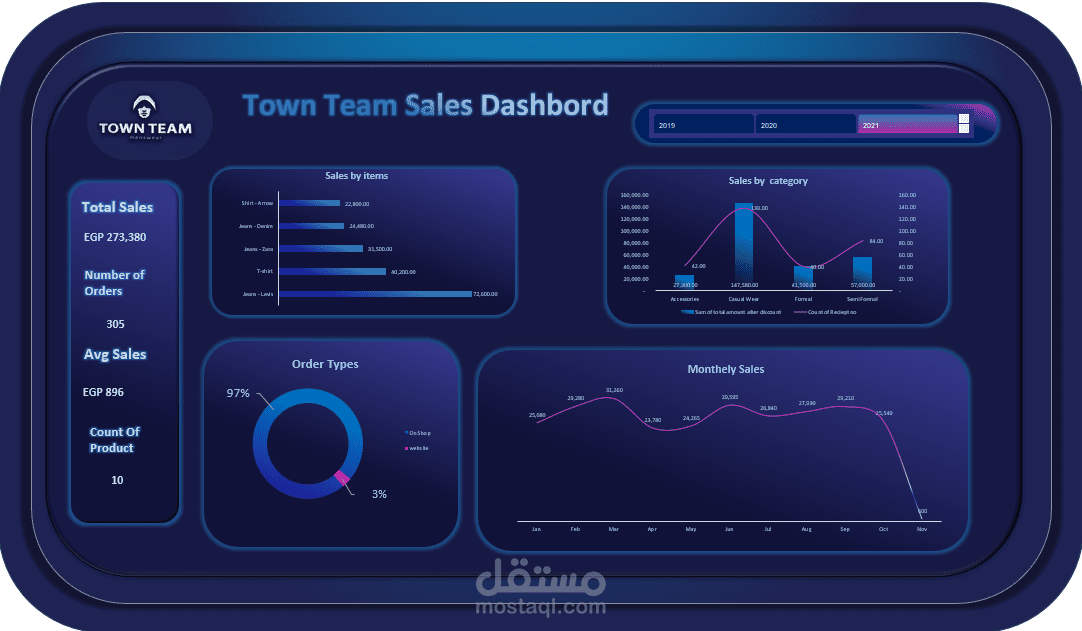
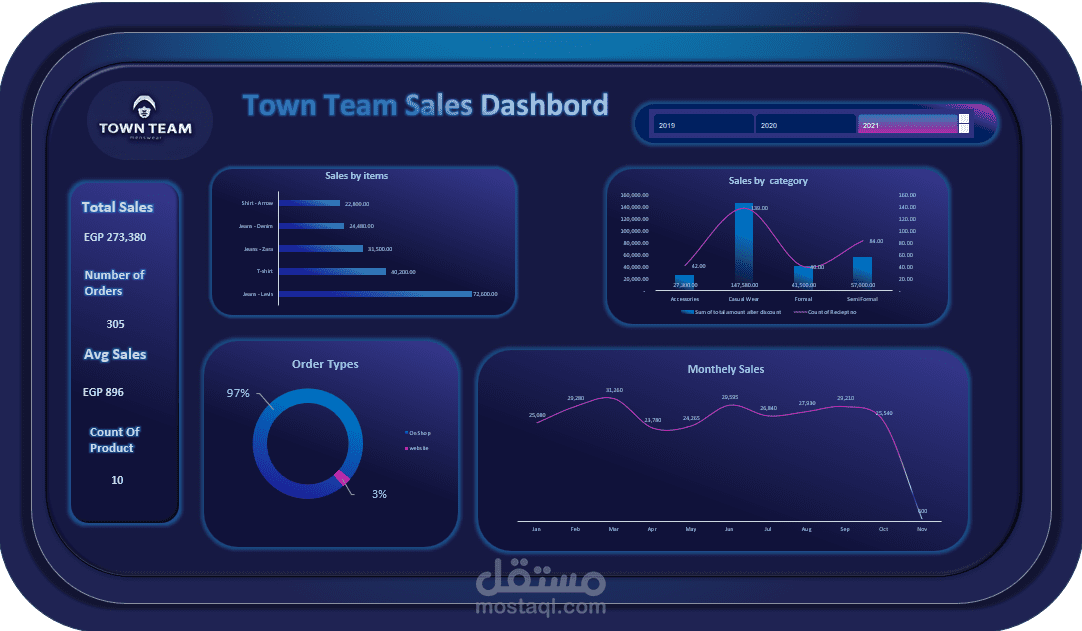
• Designed and developed an interactive sales dashboard to analyze 366 orders and EGP 339K+ in sales, providing insights into product performance, sales channels, and monthly sales trends.
• Tools: Microsoft Excel, Pivot Tables, Pivot Charts, Slicers, and KPI Cards to clean, transform, and visualize sales data across products, categories, and years (2019–2021).
• Outcome: Identified top-performing products, compared sales across categories, tracked average order value (EGP 928), and analyzed customer purchasing channels to support data-driven business decisions.