Interactive dashboard for analyzing smartphone sales and products.
تفاصيل العمل
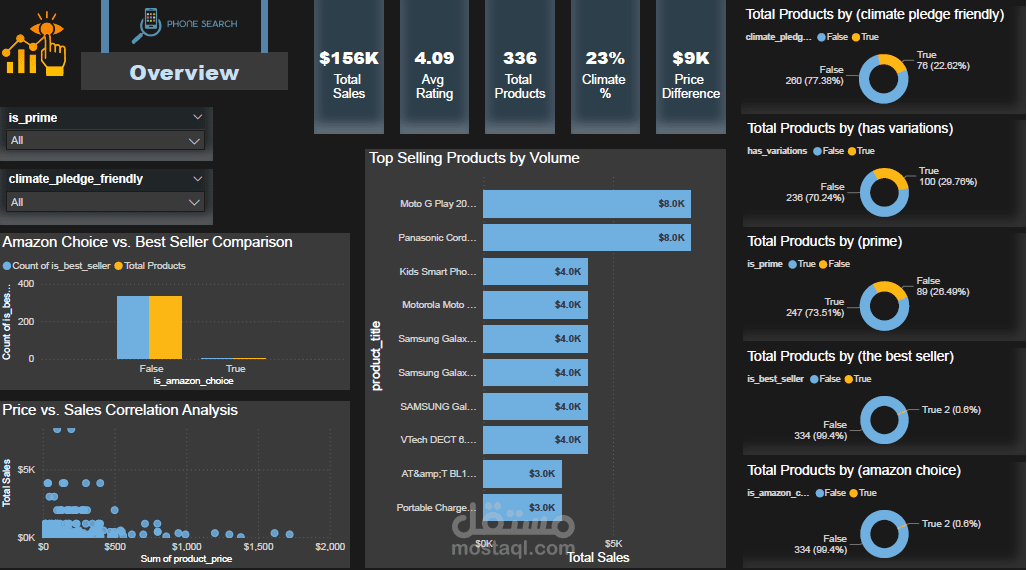
I designed and built a comprehensive, interactive dashboard using Power BI to analyze product sales performance and evaluate factors influencing business performance.
Key highlights of this report include:
Key Performance Indicators (KPIs): Displaying total sales, average ratings, and total product count.
Correlation Analysis: Creating a scatter plot to examine the relationship between product prices and actual sales volume, aiming to identify optimal pricing strategies.
Top-Selling Product Analysis: Ranking products by sales volume to identify those with the highest demand.
Comparative Analysis: Comparing the performance of "Amazon's Choice" products against "Best Seller" products.
Proportional Product Distribution: Analyzing product shares based on various attributes—such as variants, shipping methods, and badges—using donut charts.
Tools Used: Power BI, DAX formulas, data modeling, and data visualization.