Sales Performance Dashboard
تفاصيل العمل
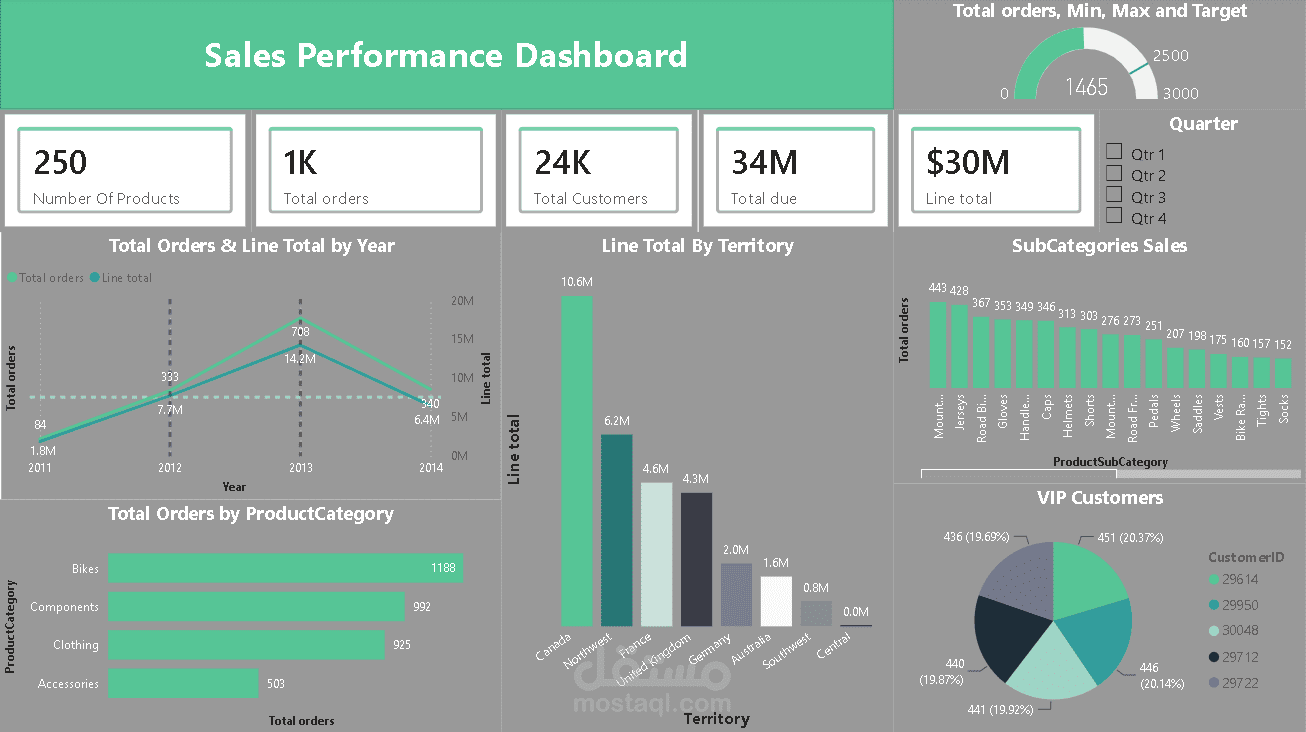
•Engineered an end-to-end interactive dashboard in Power BI to analyze $30M in revenue, 1K orders, and 24K customers.
•Designed a dual-axis temporal trend chart that uncovered a revenue peak of $14.2M in 2013.
•Segmented geographical sales data, identifying Canada as the primary revenue driver with $10.6M+ in sales.
•Profiled top-tier VIP customers to deliver actionable data-driven insights for targeted marketing and customer retention