EdTech Platform Analytics Dashboard
تفاصيل العمل
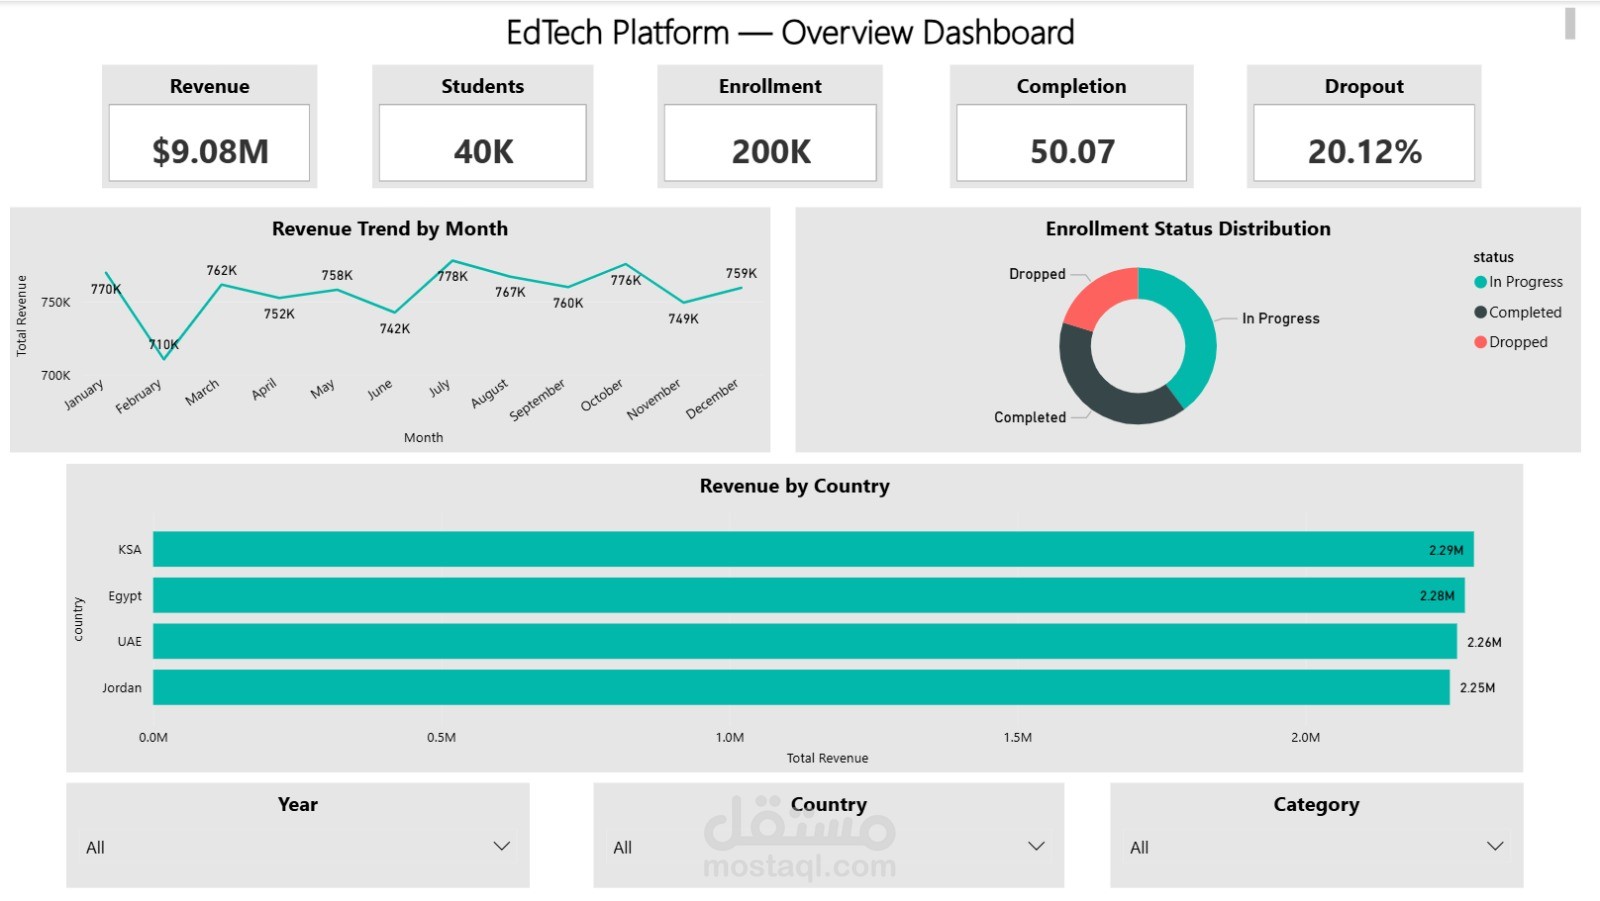
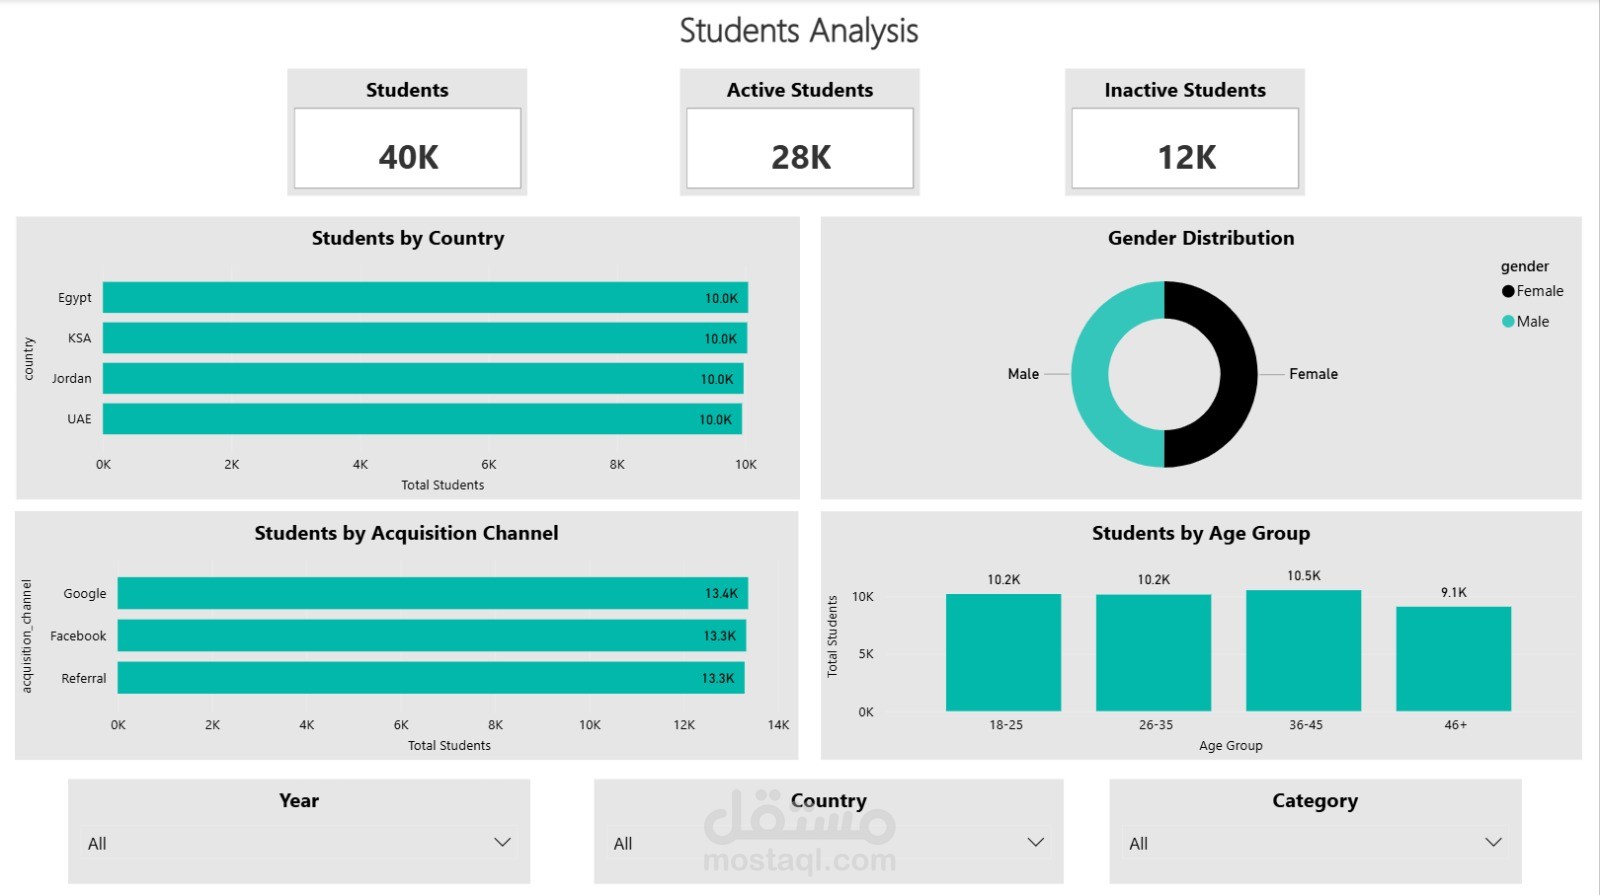
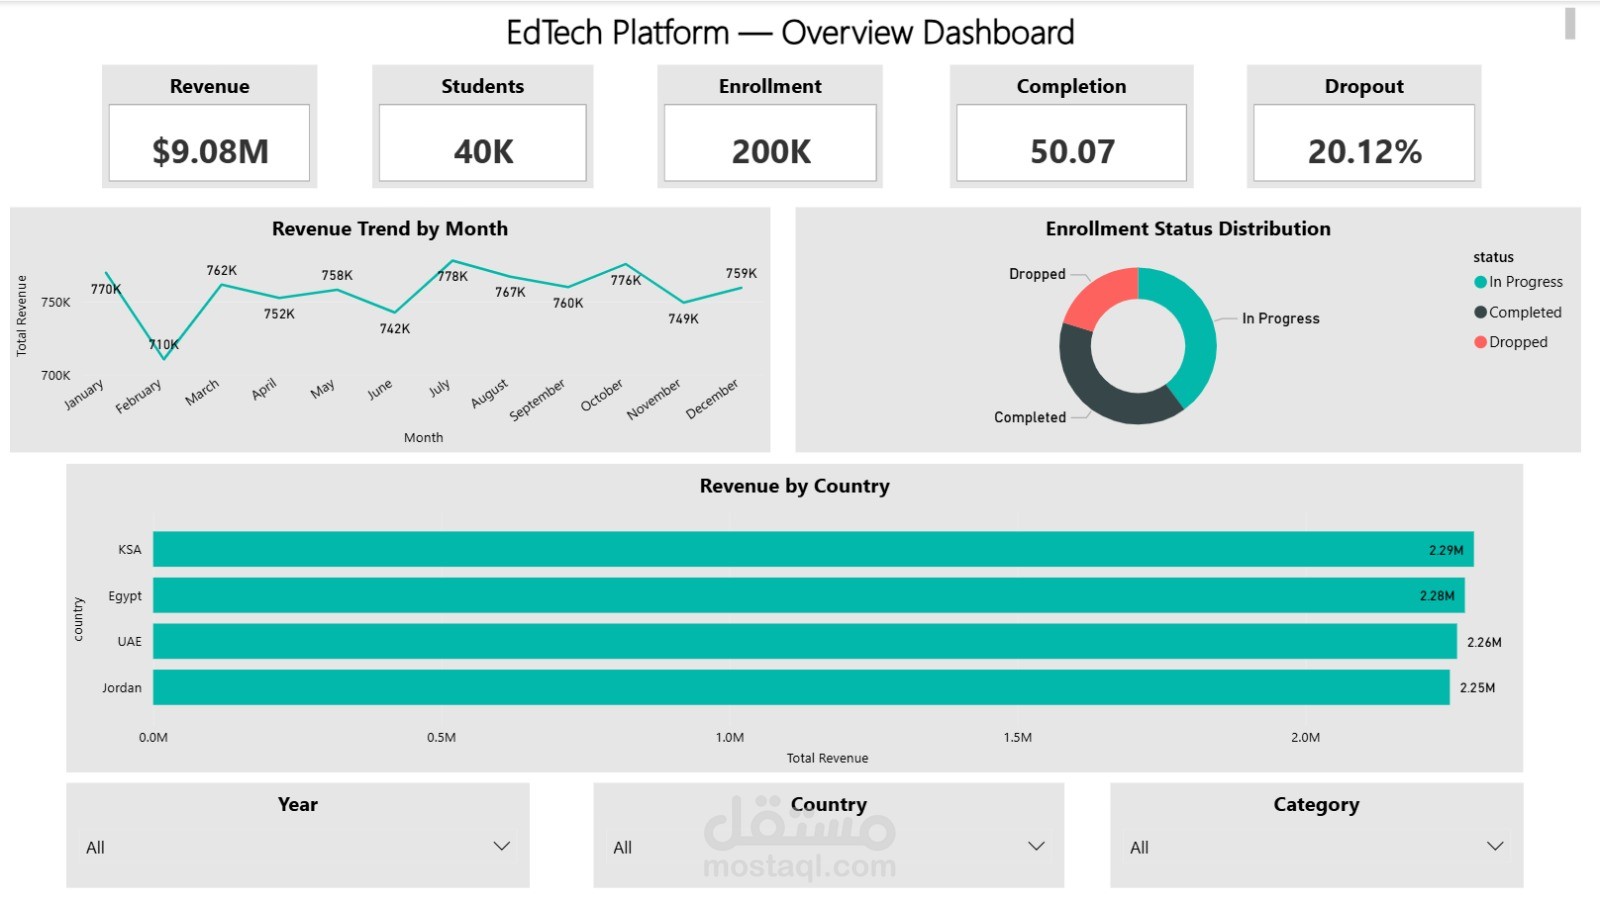
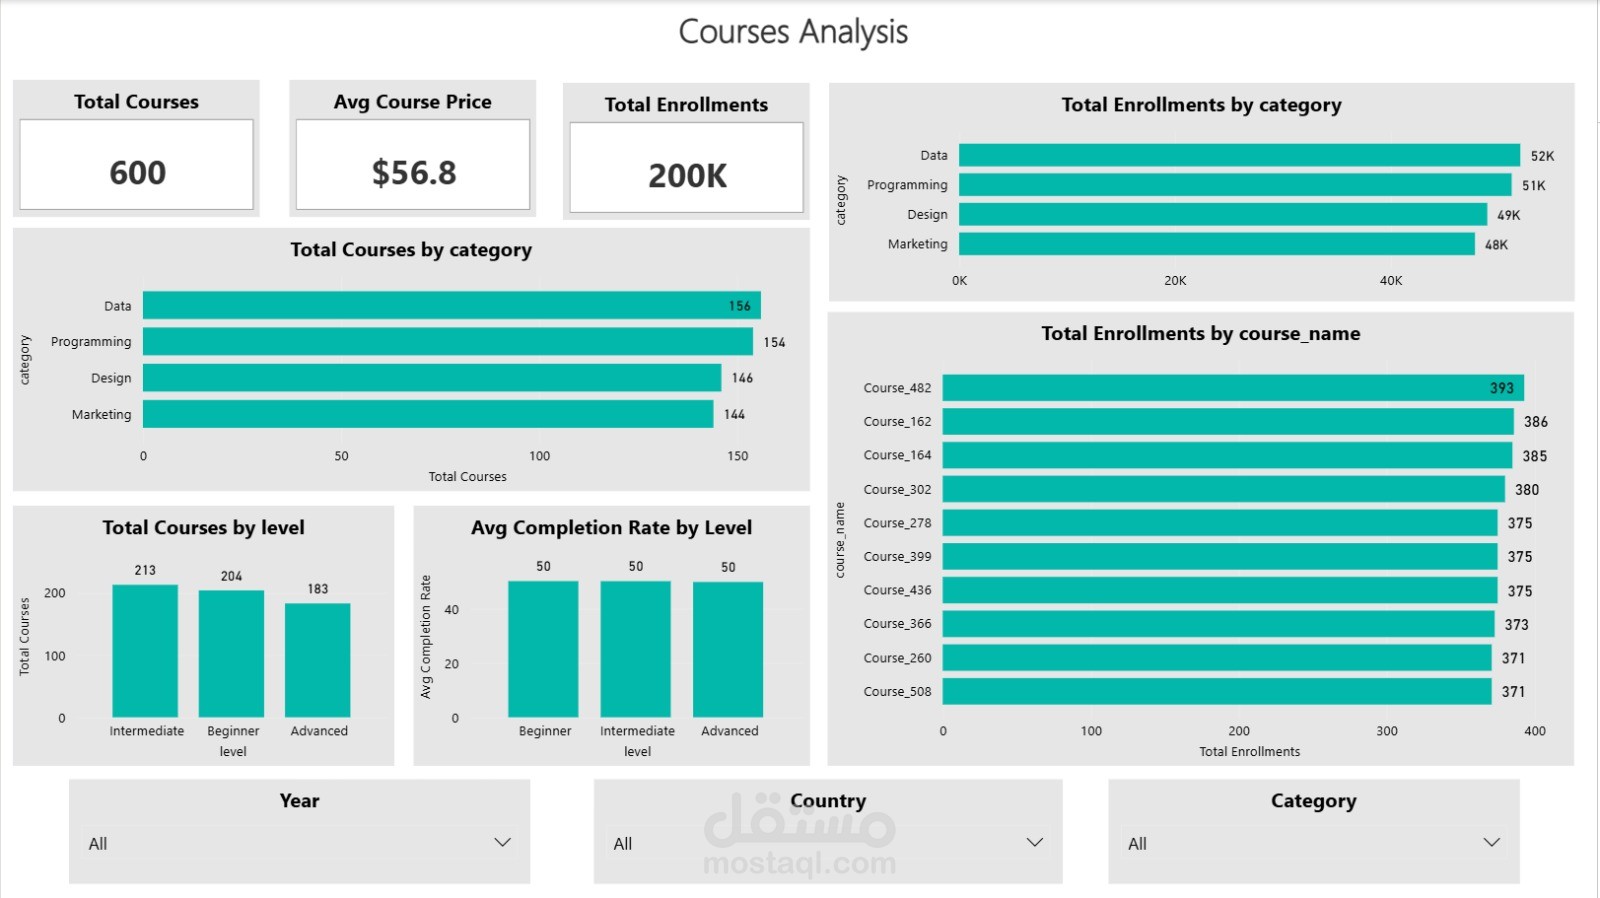
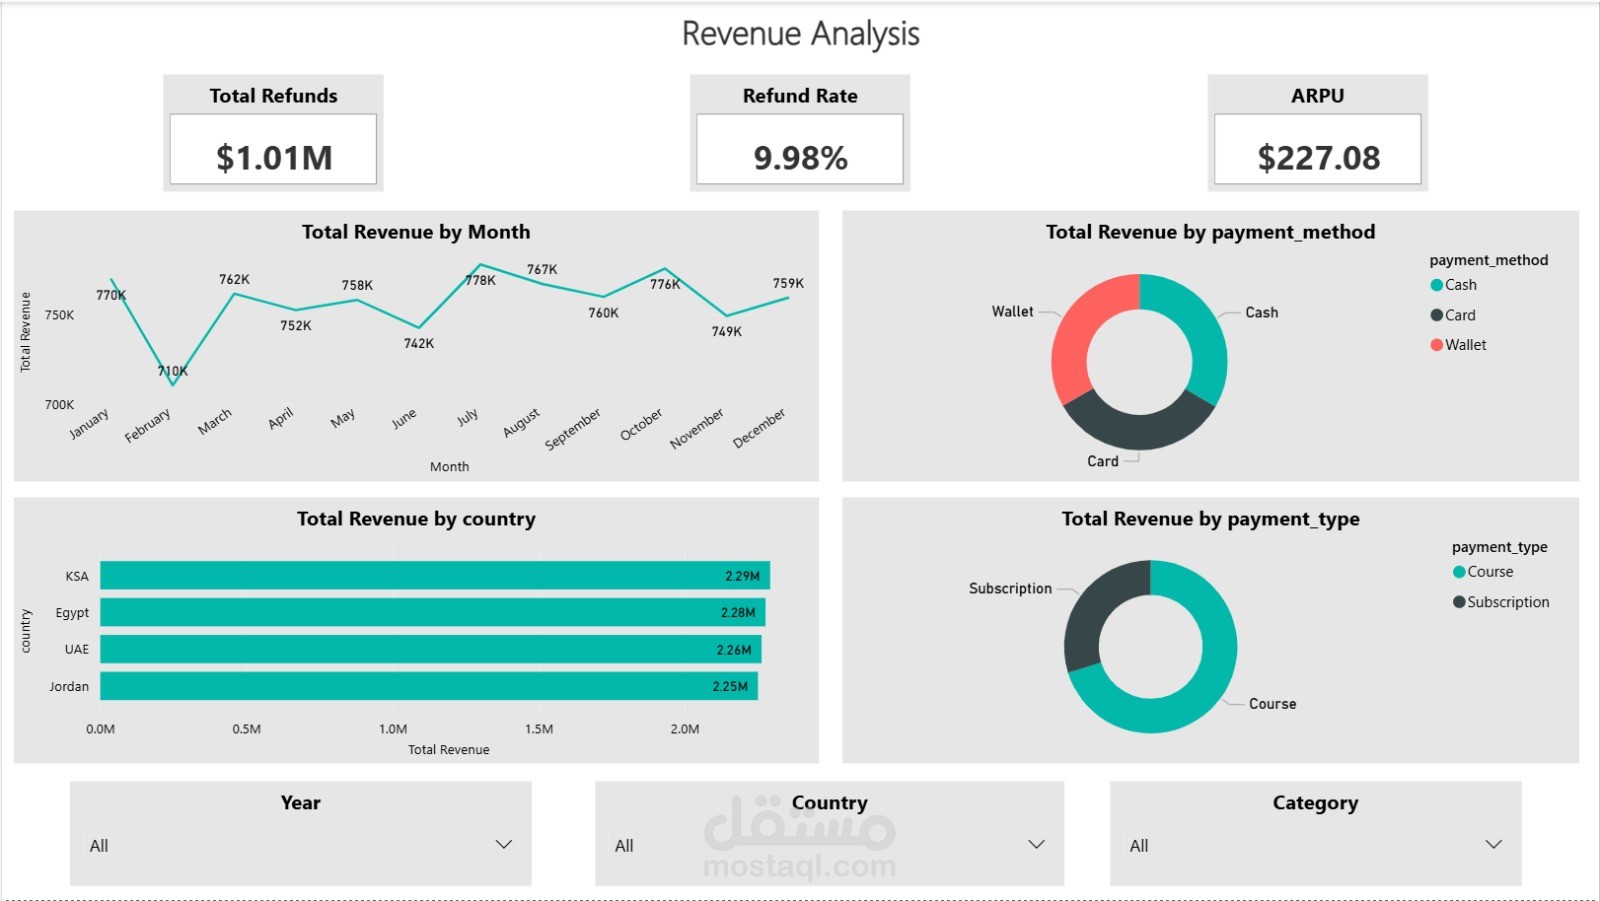
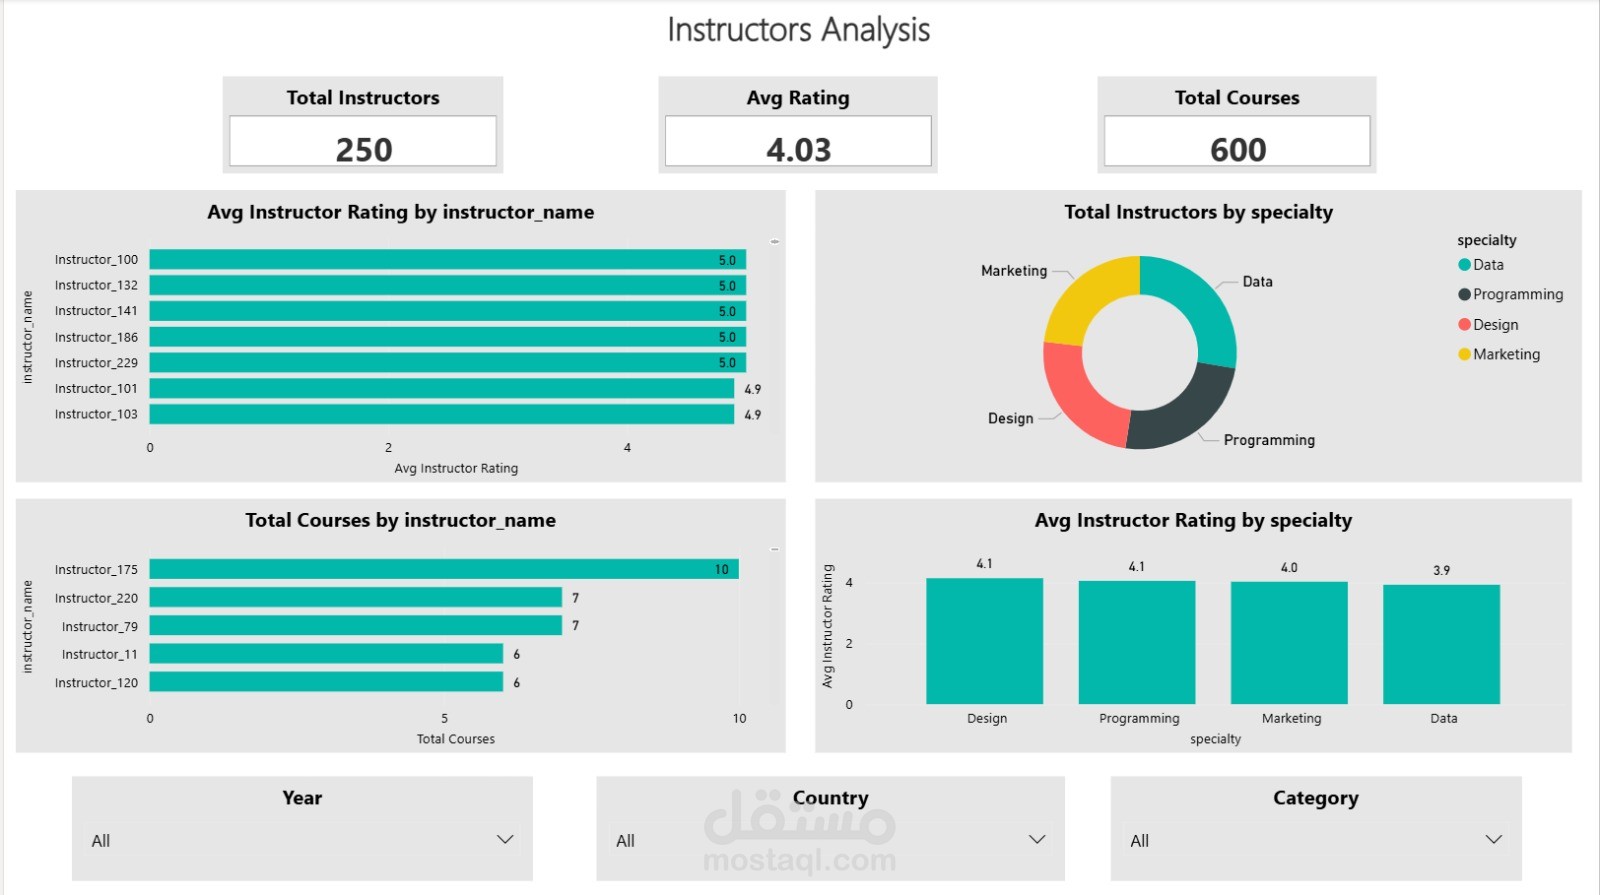
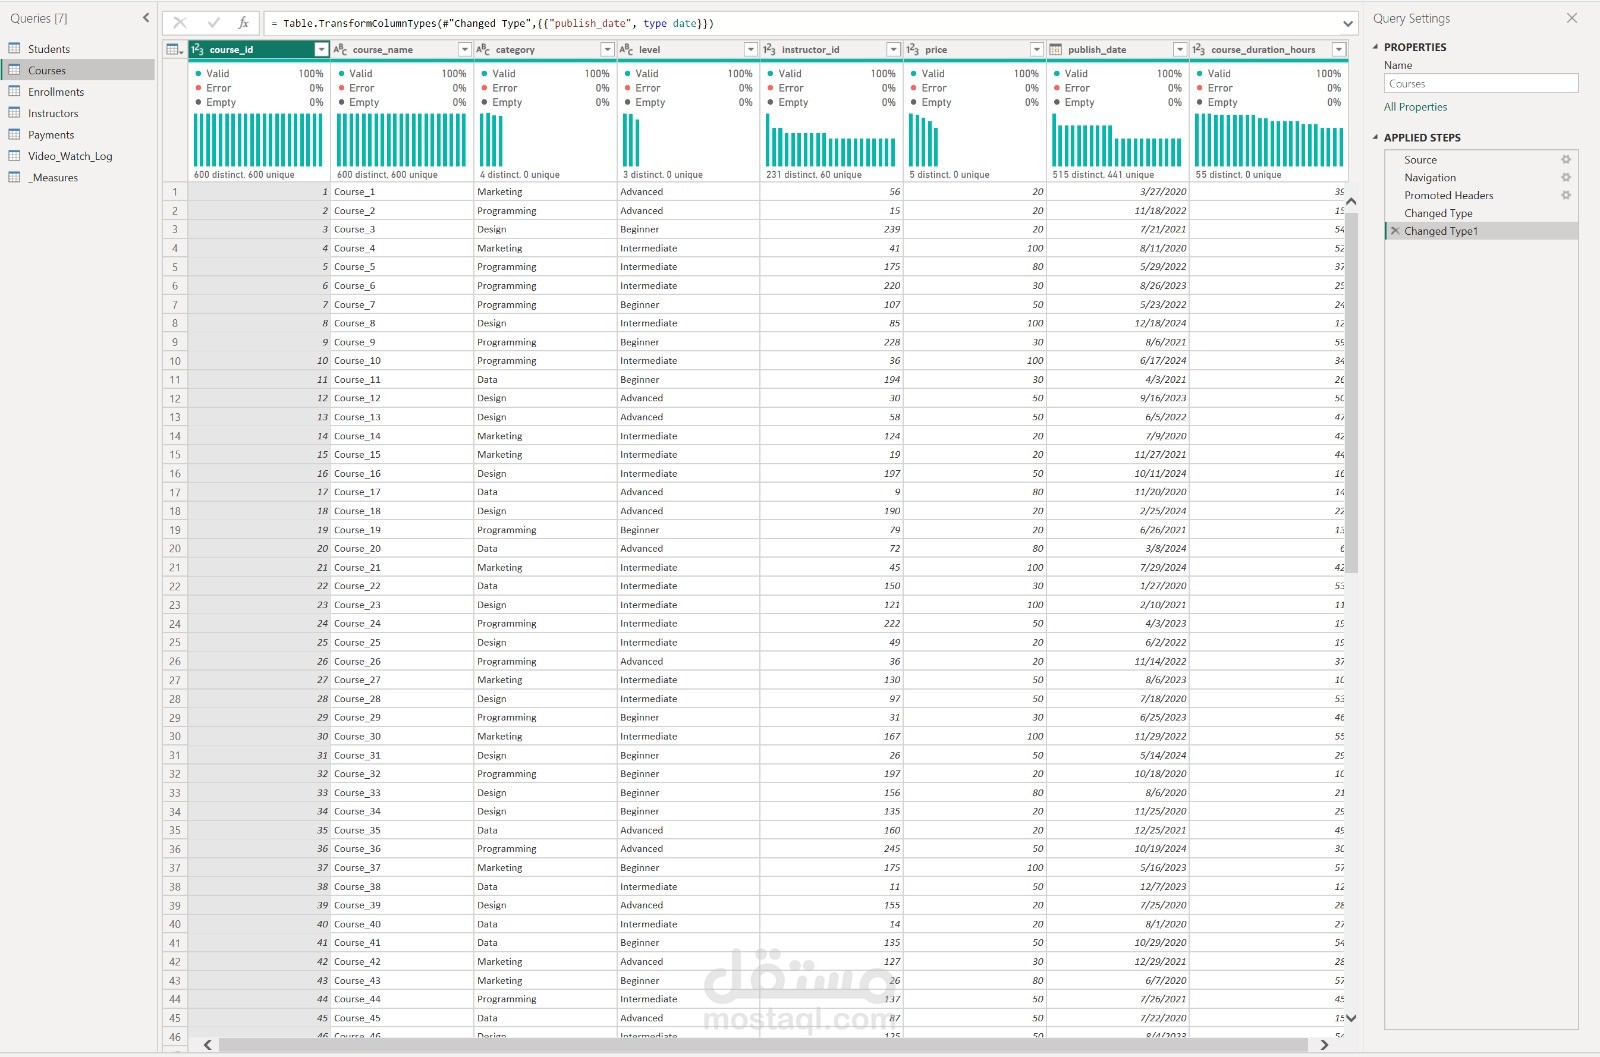
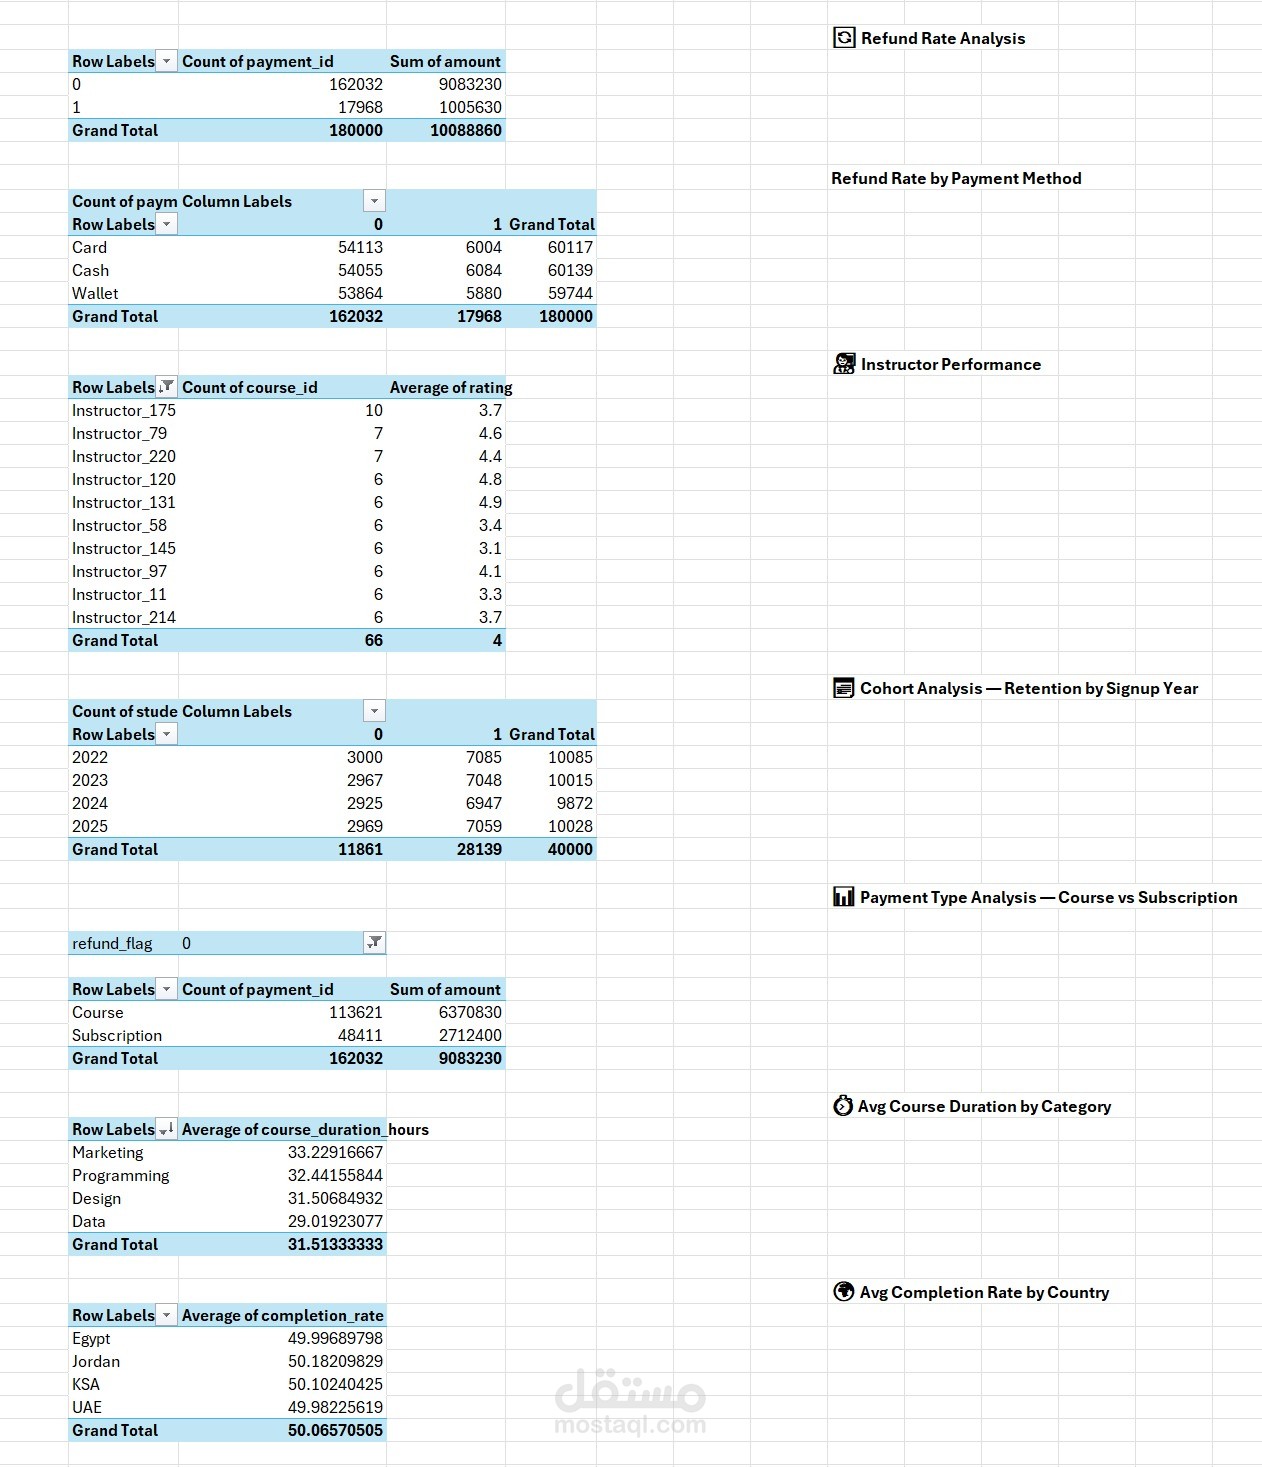
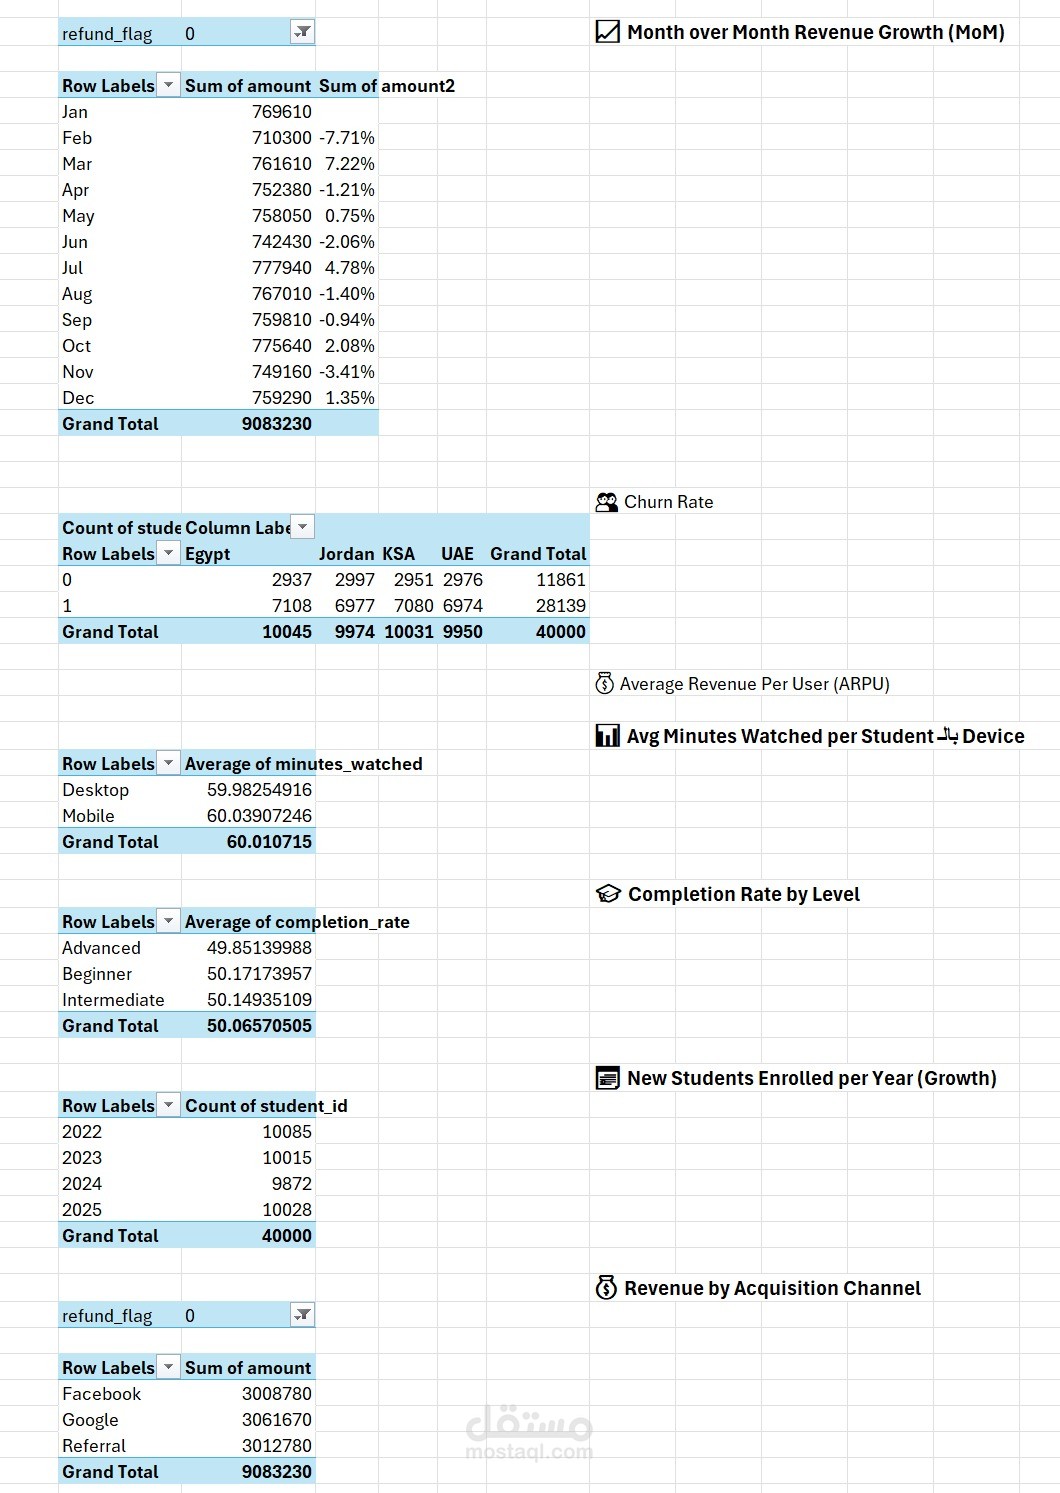
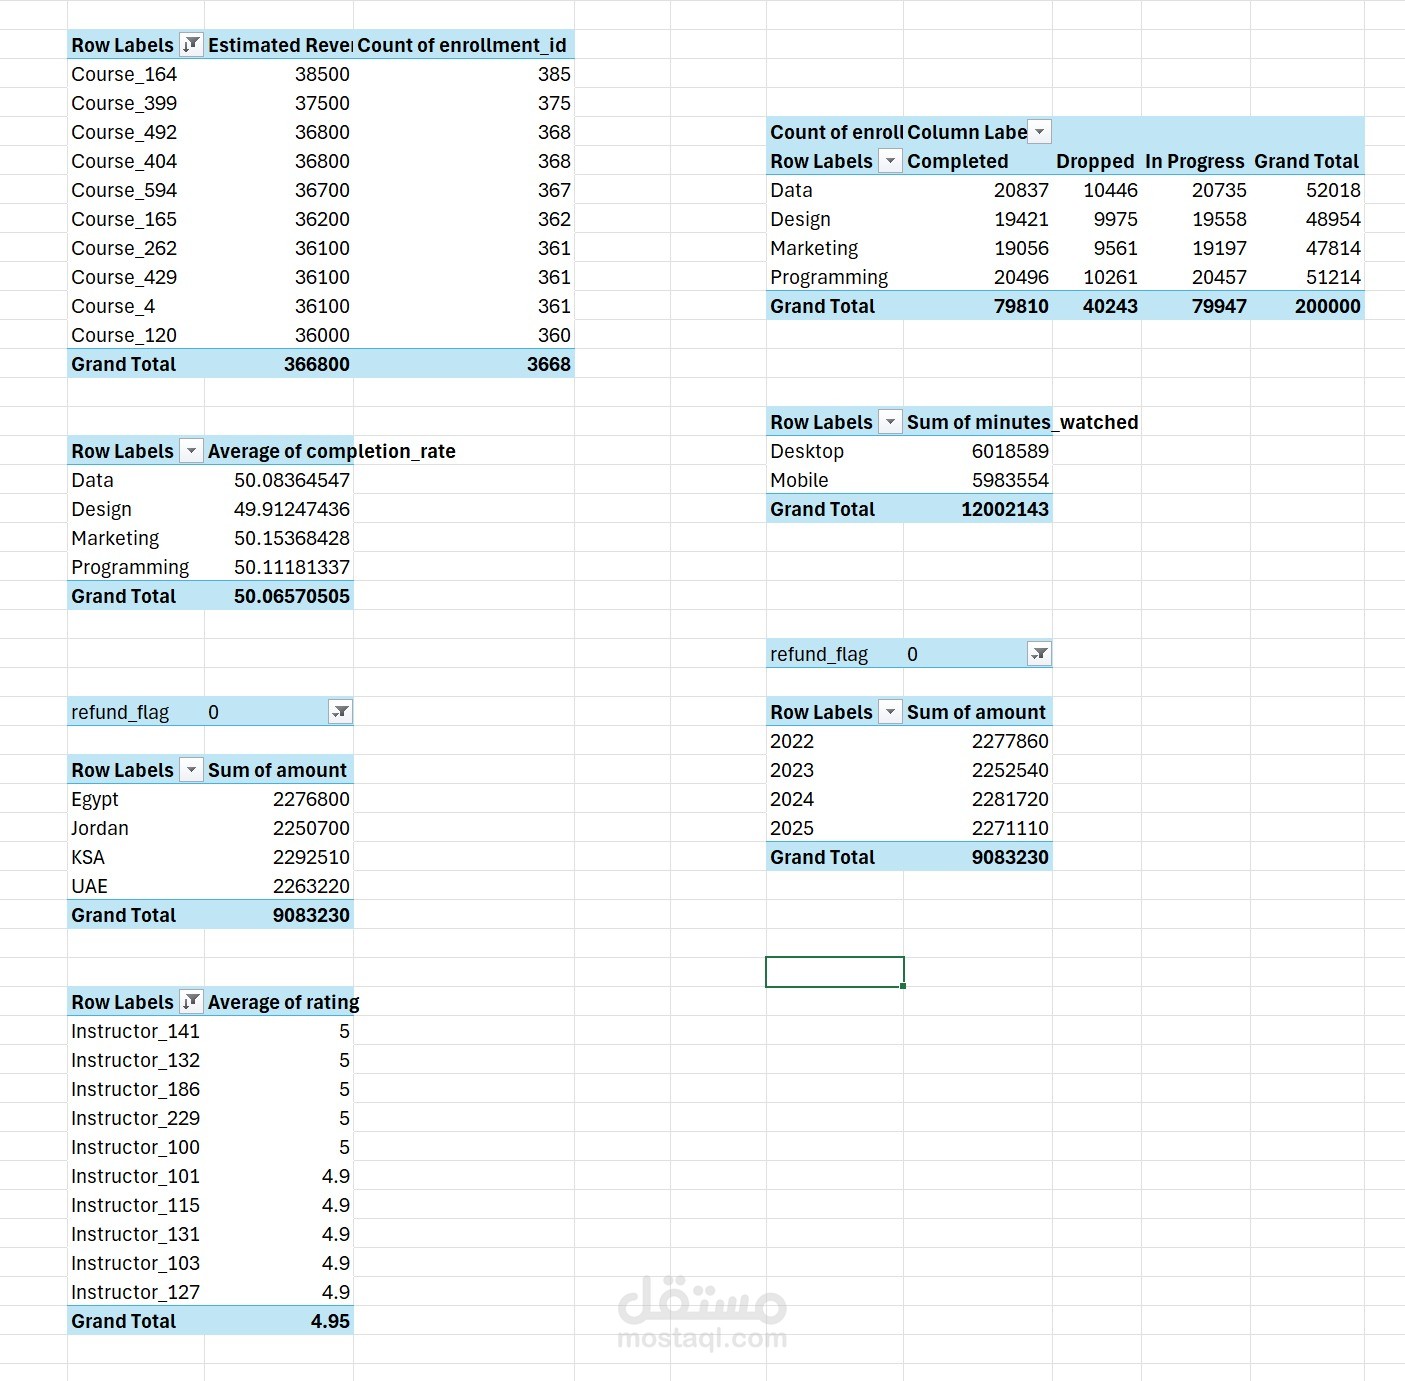
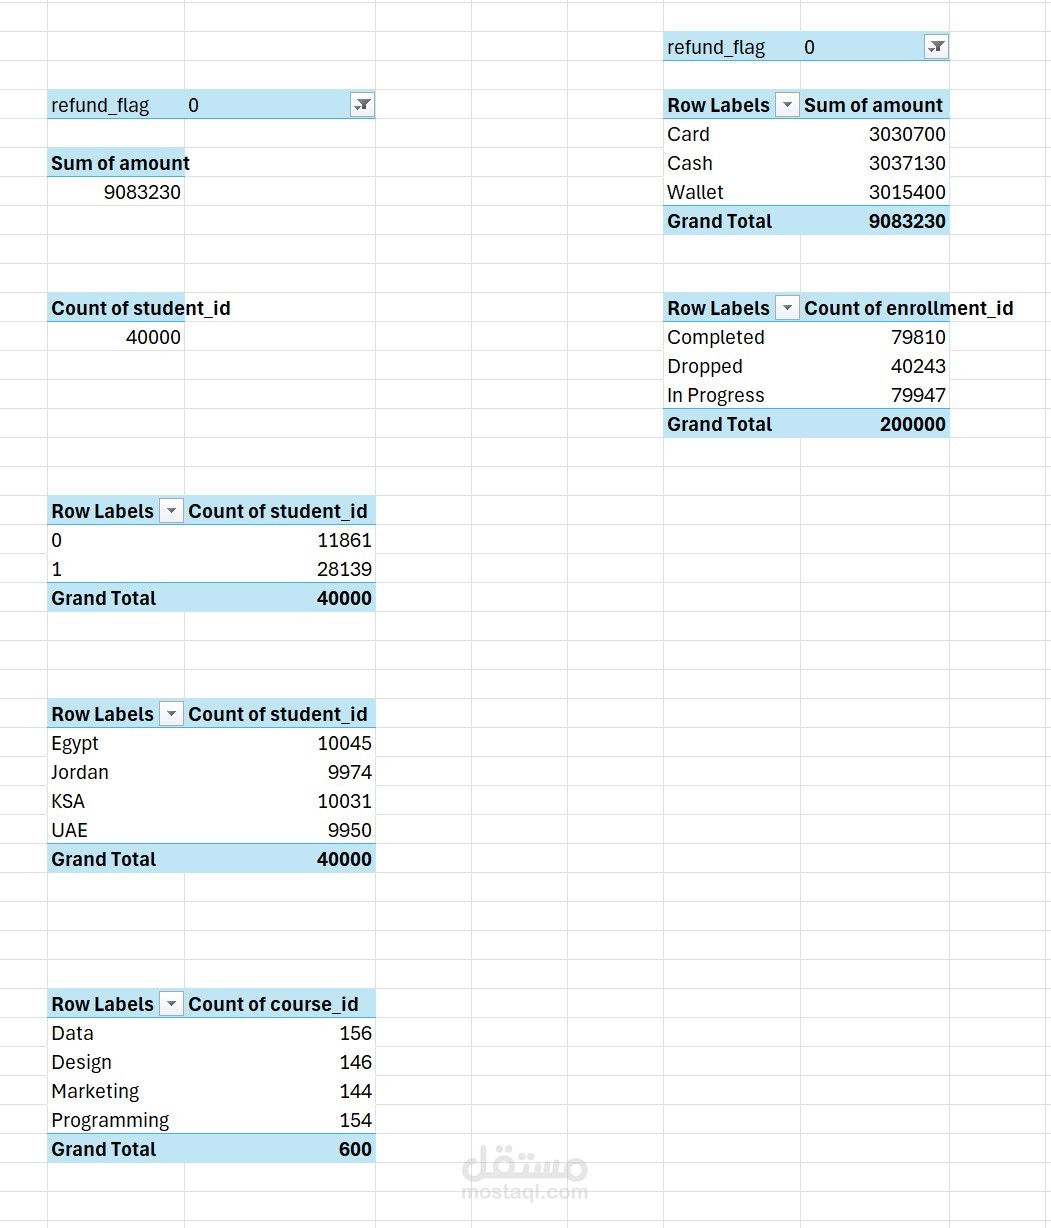
End-to-end analysis of an EdTech platform covering 40,000 students, 600 courses, and $9M+ revenue across 6 interconnected tables (620,000+ rows). Raw data had country/city mismatches and no direct link between payments and courses. I cleaned the data in Power Query, built a star schema model, and created 15+ DAX measures powering a 5-page Power BI dashboard (Overview, Students, Courses, Revenue, Instructors). Delivered 28 business insights, including a 9.9% refund rate ($1M loss), a 20% dropout rate, and a flat growth trend — enabling data-driven retention and pricing decisions.