Lipton Egypt — Secondary Sales Dashboard (FMCG)
تفاصيل العمل
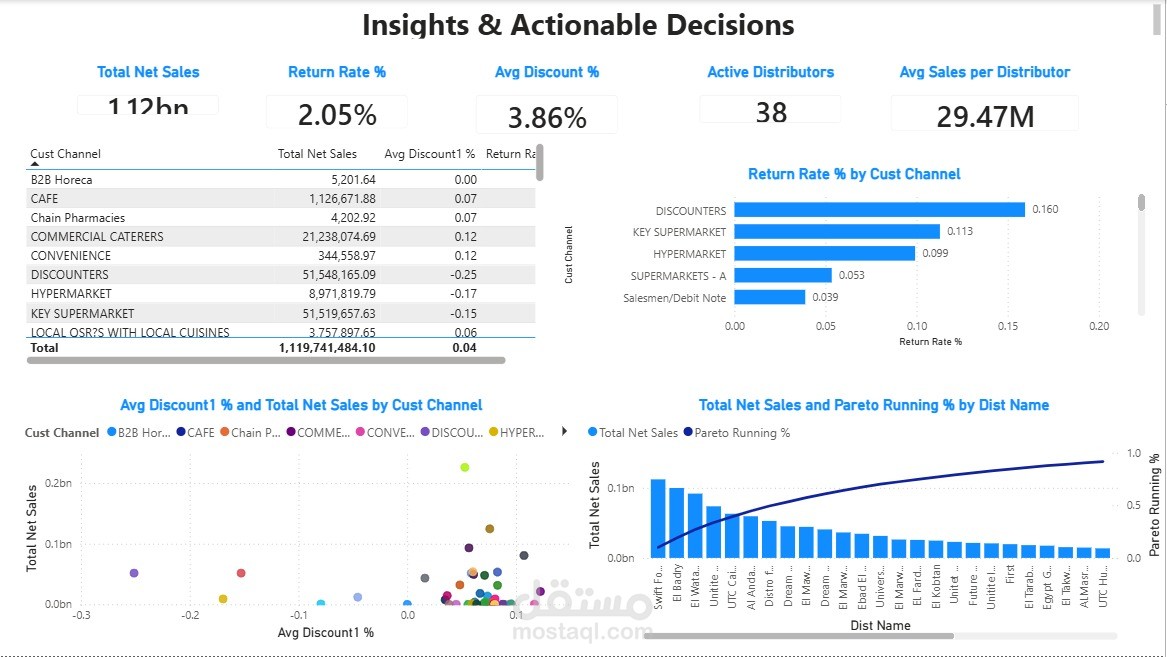
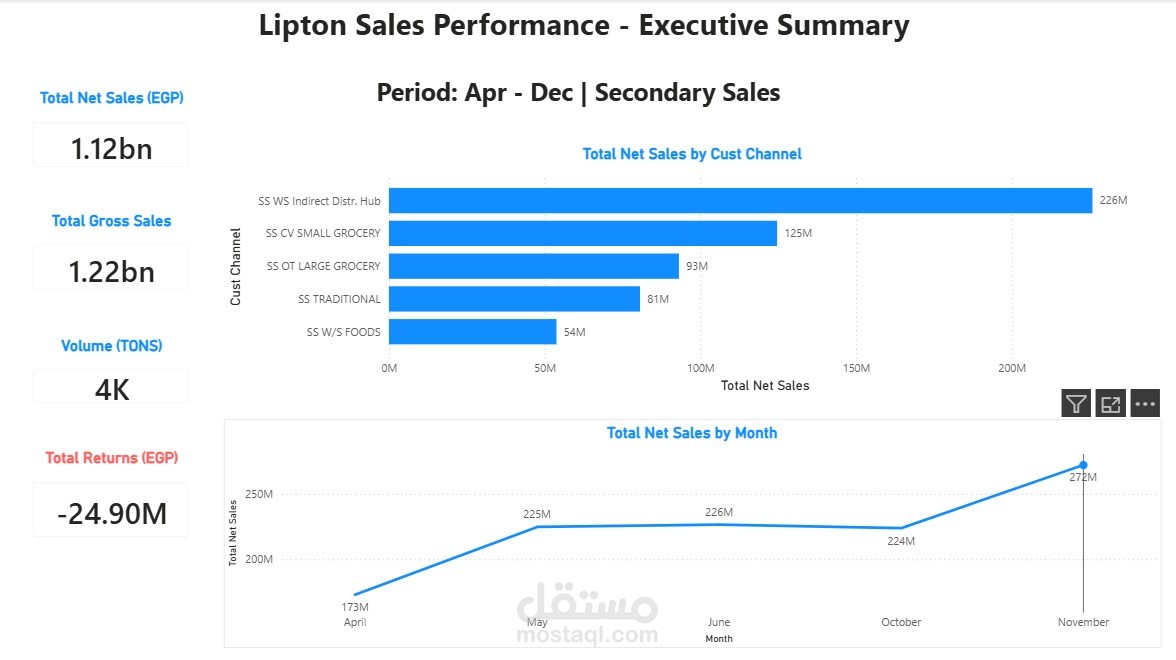
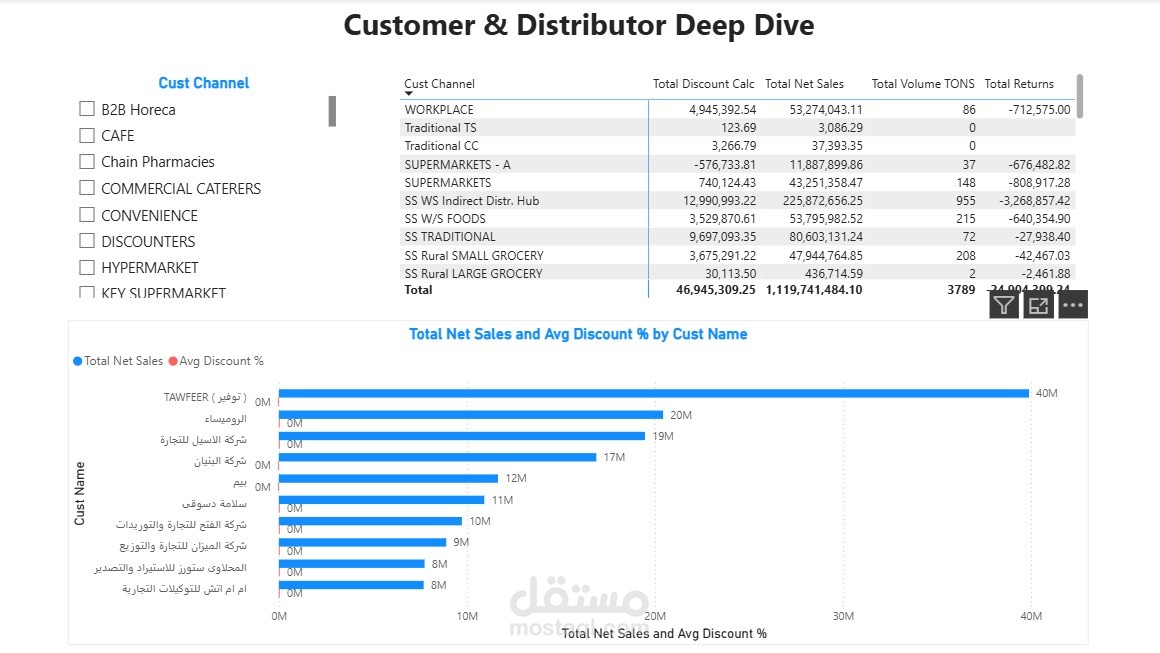
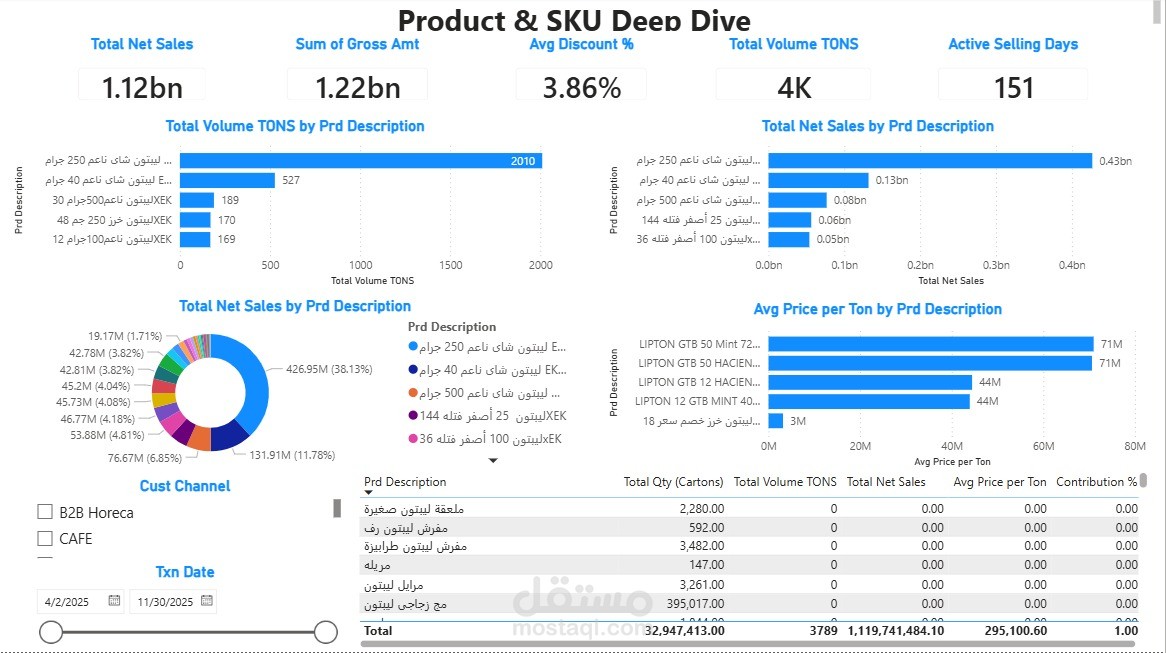
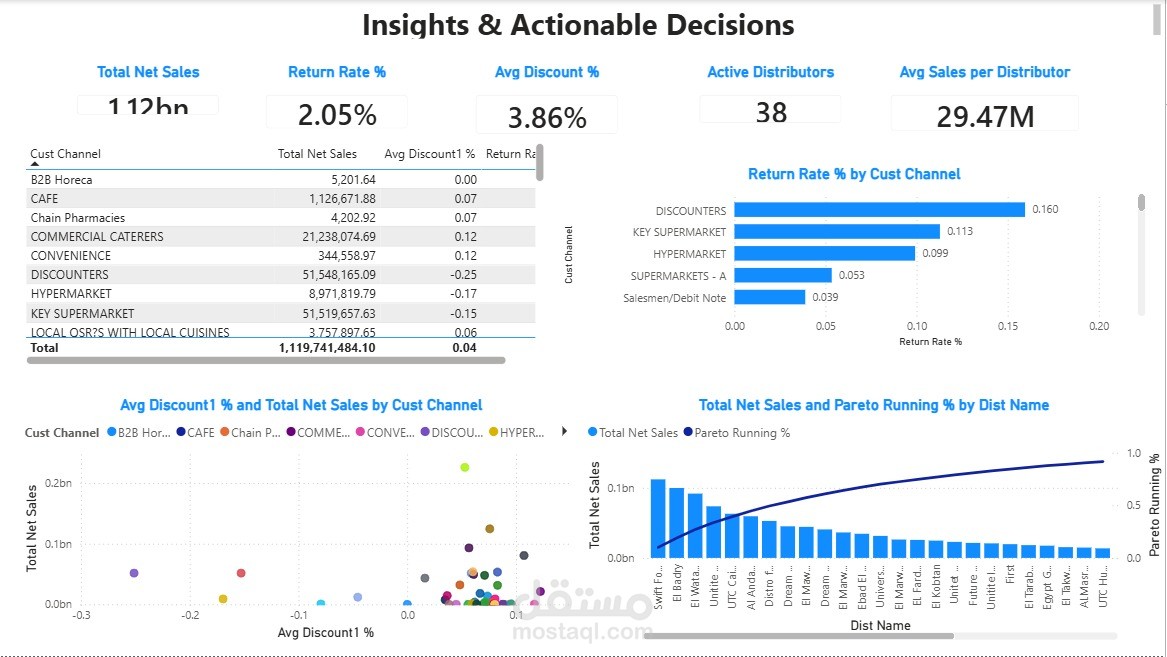
Built a Power BI dashboard analyzing 1.7M+ rows of secondary sales data for Lipton Egypt across 9 months. Sourced from SQL Server, the data had zero-value discount fields and no invoice ID, blocking standard financial reconciliation. I reconstructed the discount metric using DAX (Gross − Net excl. Returns − ABS Returns) and built a 4-page report with conditional formatting and Pareto analysis. Result: a clear view of 1.12B EGP in net sales, with visibility into return rates, distributor efficiency, and SKU-level performance for both operational and executive decision-making.