1. Sales Performance Dashboard (Power BI)
تفاصيل العمل
Project Description:
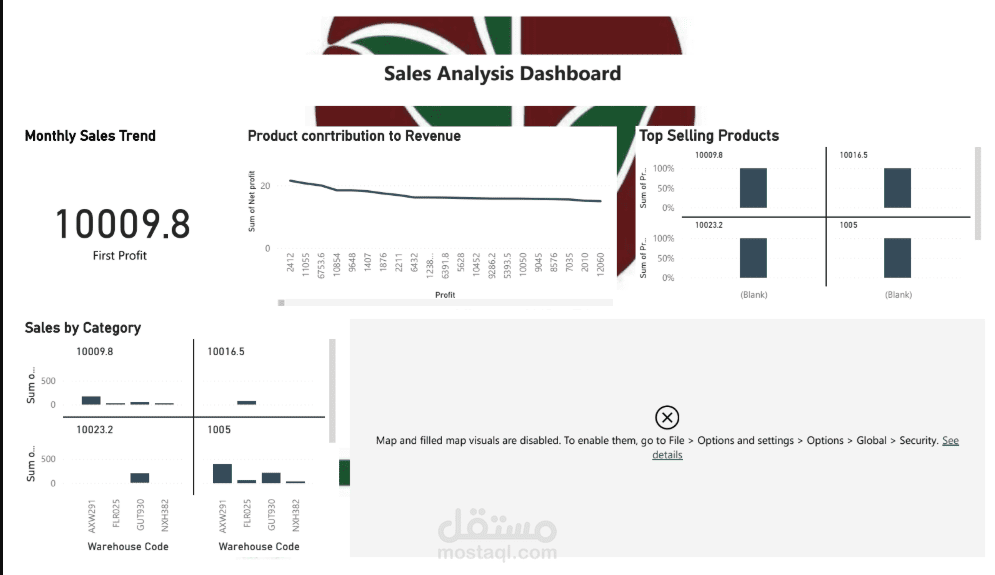
Developed an interactive Power BI dashboard to analyze sales performance across multiple regions and product categories. The dashboard enables business leaders to monitor KPIs, identify sales trends, and make data-driven decisions.
Responsibilities:
Cleaned and transformed sales data using Power Query.
Built a star schema data model.
Created DAX measures for revenue, profit, margin, and growth.
Designed interactive dashboards with slicers and drill-through functionality.
Automated monthly reporting.
Tools Used:
Power BI
Excel
Power Query
DAX
Key Results:
Reduced reporting time by 80%.
Identified top-performing products and underperforming regions.
Improved executive reporting through interactive visualizations.