Interactive Sales Dashboard in Excel
تفاصيل العمل
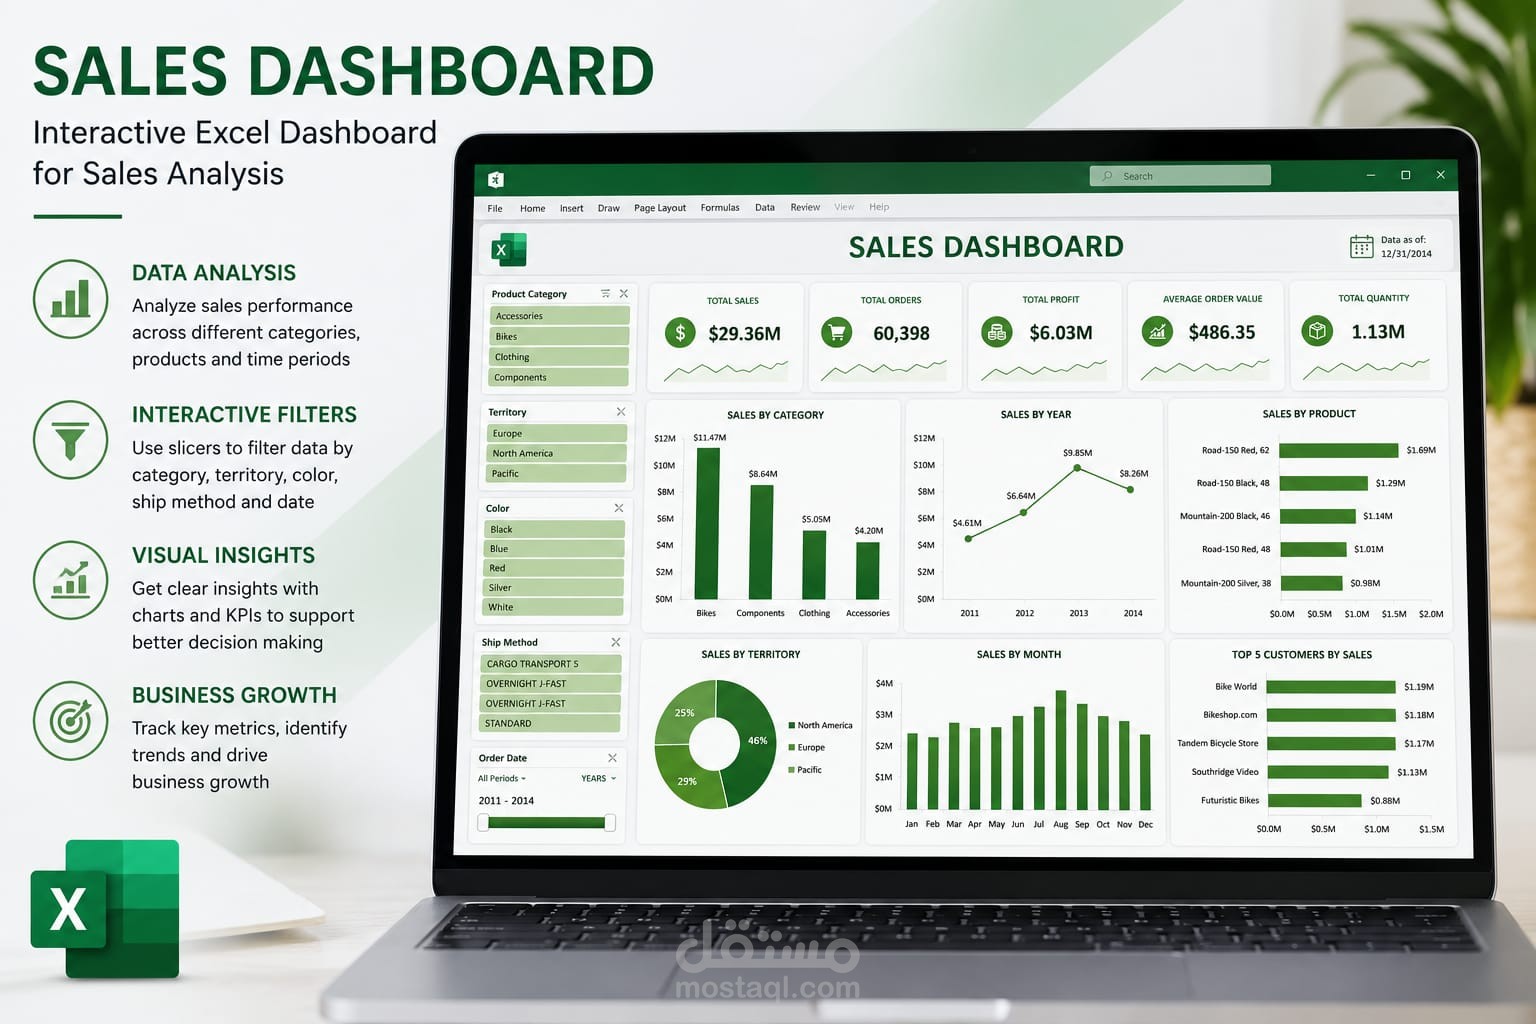
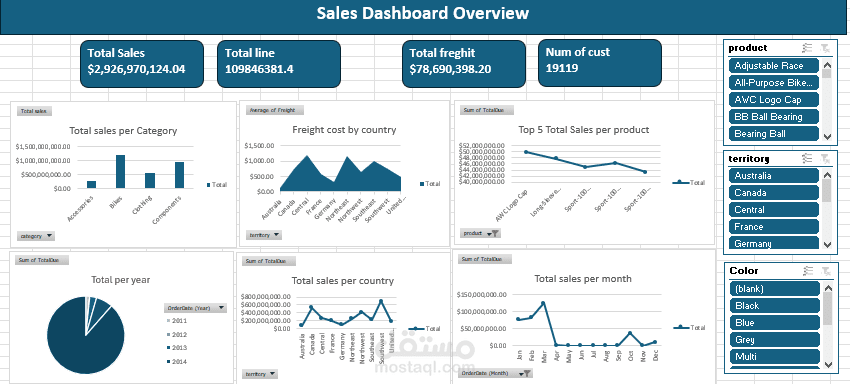
Developed an interactive Sales Dashboard in Microsoft Excel using PivotTables, PivotCharts, Slicers, and KPI Cards to analyze sales performance. The dashboard provides insights into Total Sales, Sales by Category, Product Performance, Monthly Trends, and Territory Analysis, enabling users to filter data dynamically and make data-driven decisions.
الأدوات
Microsoft Excel
PivotTables
PivotCharts
Slicers
Conditional Formatting
Excel Formulas
أهم المميزات
Interactive Dashboard
KPI Cards
Sales Trend Analysis
Category & Product Performance
Territory Analysis
Dynamic Filters (Slicers)
Clean and Professional Design