Bank Transactions Analytics Dashboard | Excel Data Analysis
تفاصيل العمل
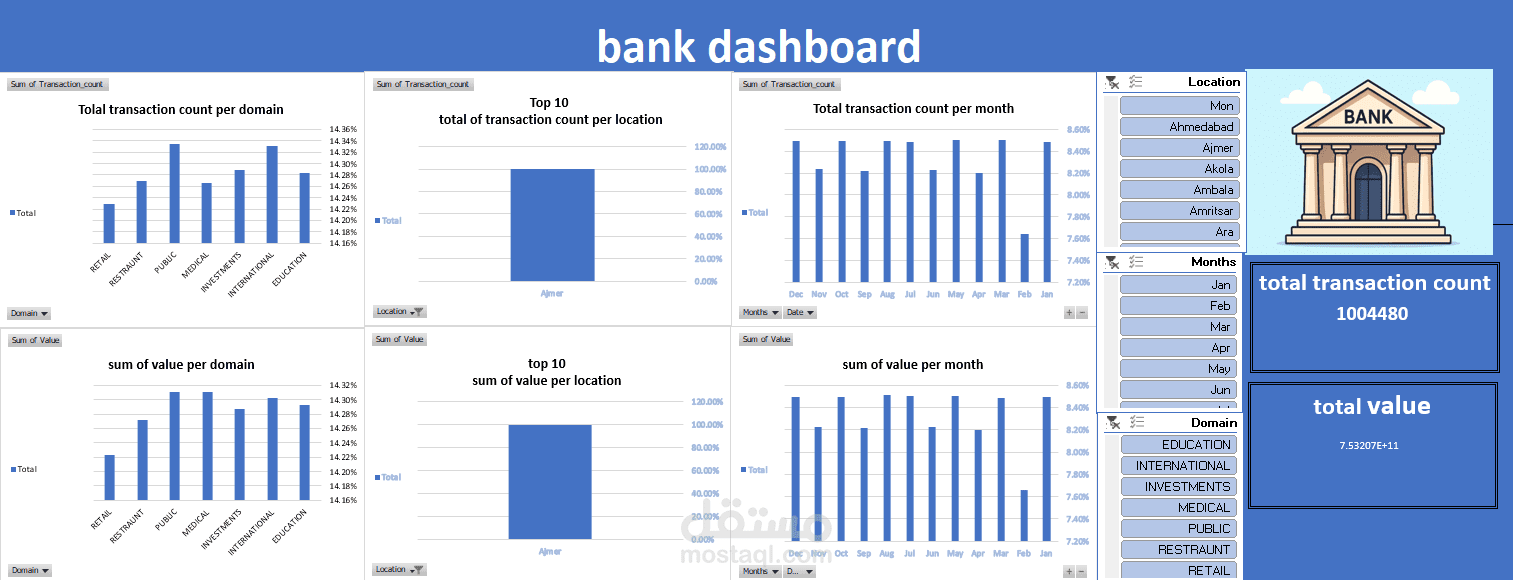
An interactive Excel dashboard project analyzing large-scale banking transaction data to uncover operational trends, business domain performance, branch activity, and monthly transaction patterns.
The project focuses on transforming raw transaction data into meaningful insights through data preparation, aggregation, analysis, and interactive visualization.
Key Analysis:
- Transaction volume and value analysis
- Performance comparison across business domains
- Branch-level activity analysis
- Monthly transaction trends
- Identification of growth opportunities and weak-performing segments
Tools Used:
Microsoft Excel, Pivot Tables, Pivot Charts, Slicers, Excel Formulas
Project Workflow:
- Data Cleaning & Preparation
- Data Aggregation
- Exploratory Data Analysis (EDA)
- Dashboard Development
- Business Insights Generation
This dashboard helps banking teams monitor transaction performance, identify trends, compare operational areas, and support data-driven decision-making.