E-commerce sales analysis
تفاصيل العمل
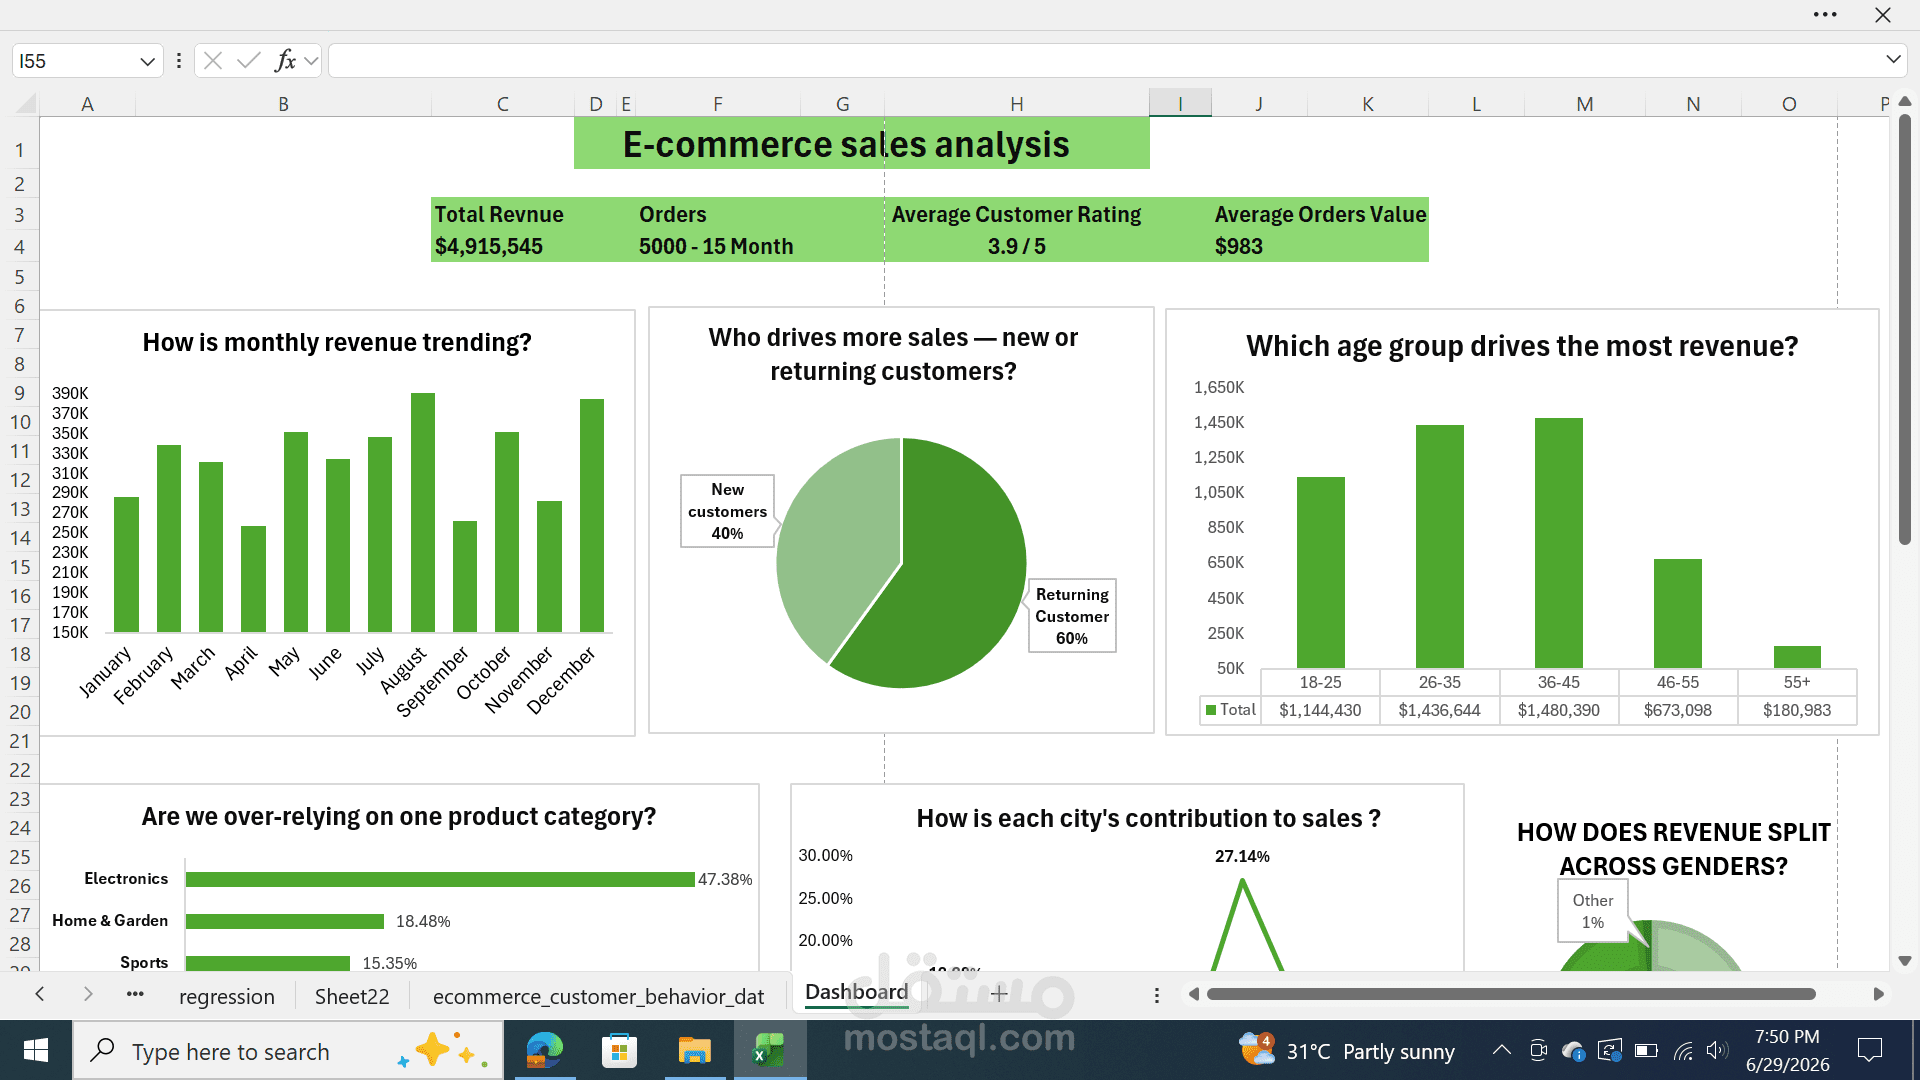
This project presents an interactive E-Commerce Sales Performance Dashboard
built in Microsoft Excel to transform raw sales data into meaningful business insights. The dashboard enables decision-makers to monitor key performance indicators, analyze customer behavior, evaluate product performance, and identify revenue trends through dynamic visualizations and slicers.
Tools & Skills Used
Microsoft Excel
Pivot Tables & Pivot Charts
Slicers
Power Query (Data Cleaning & Transformation)
Advanced Excel Formulas
Data Visualization
Dashboard Design
Business Intelligence & KPI Reporting
Key Features
Interactive dashboard with dynamic slicers
Revenue, Orders, Average Order Value, and Customer Rating KPIs
Monthly revenue trend analysis
Sales analysis by product category, city, gender, age group, customer type, and device
Payment method performance analysis
Average order value by day of the week
Executive insights and actionable business recommendations
Business Insights
The analysis revealed that returning customers generated the majority of revenue, Electronics was the highest-performing product category, and mobile devices accounted for most purchases. It also identified top-performing cities, customer segments, and seasonal sales patterns, helping stakeholders make informed business decisions.
Business Recommendations
Increase customer retention through loyalty programs.
Optimize the mobile shopping experience to improve conversions.
Reduce reliance on Electronics by promoting other product categories.
Invest more in high-performing cities while expanding lower-performing markets.
Launch weekend promotions to increase sales on low-performing days.
Outcome
This dashboard demonstrates my ability to clean, analyze, and visualize data while translating complex datasets into clear, actionable insights.