E-commerce sales performance dashboard
تفاصيل العمل
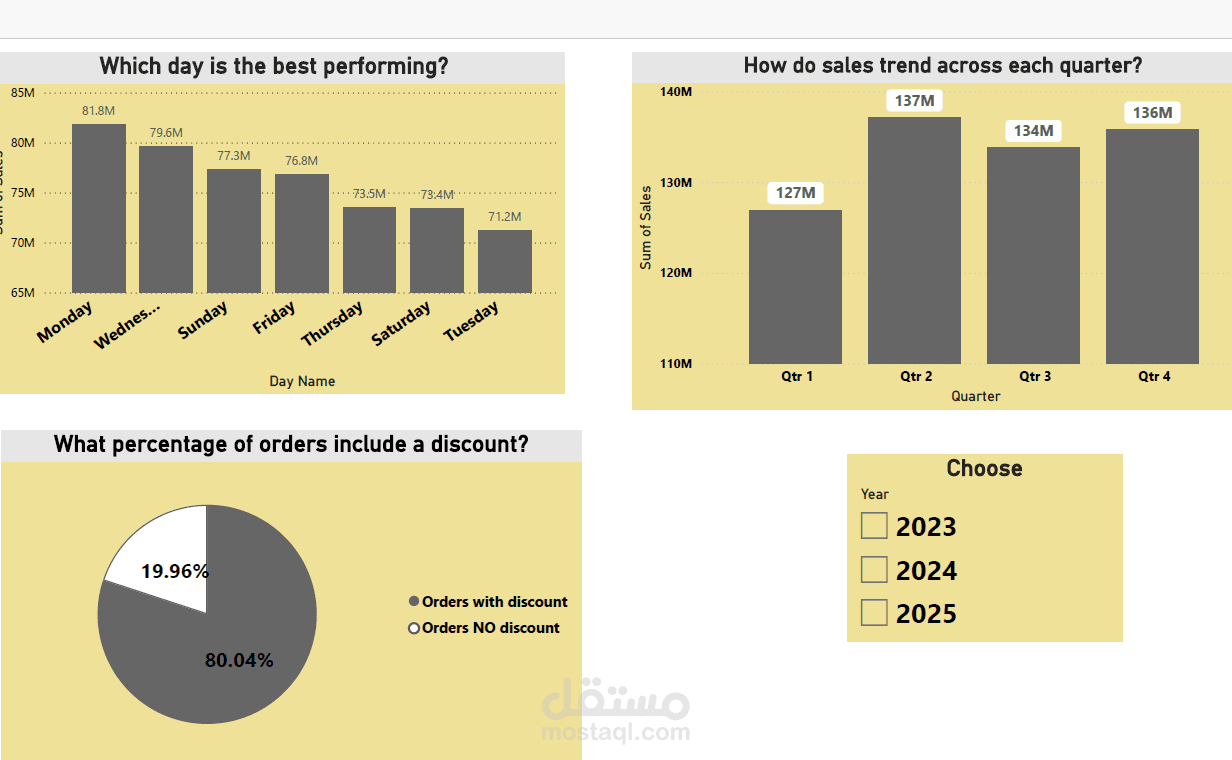
Transformed raw sales data into an interactive, executive-level dashboard that tracks ₹533.67M in total revenue, ₹79.71M net profit, 5,000 orders, and a 14.94% profit margin — all in a single, clean interface.
Key features delivered:
Monthly sales trend analysis identifying peak and low-performing months
Regional revenue breakdown across all four Indian zones
Category performance comparison across 10 product categories including Home Decor, Furniture, Clothing, and Electronics
Payment method distribution analysis covering UPI, Credit Card, Debit Card, COD, and Net Banking
Top 15 best-selling product ranking
Day-of-week and quarterly performance trends
Discount vs. full-price order segmentation