Hospital Analytics
تفاصيل العمل


Project Objectives
Analyze hospital Management Datasets.
Clean and prepare raw data for analysis
Build an interactive Power BI dashboard
Track key KPIs (Patients, Revenue, appointments)
Support data-driven decision making
Business Understanding
A hospital operates as an integrated system that provides medical services to patients through multiple functional units, including:
patient registration, doctor consultation, treatment, and billing.
The core services typically include:
Patient management (registration, demographics, insurance)
Doctor services (specializations, scheduling, consultations)
Appointment management (booking, status tracking)
Treatment services (procedures, diagnostics, costs)
Billing and payment processing
Dataset Description
Source: Kaggle Hospital Management Dataset
Contains the following Tables:
Patients
Doctors
Appointments
Treatments
Billing
Type: Relational dataset
Project Methodology
Steps:
Data Retrieving
Data Cleaning
Data Modeling
Data Analysis (DAX)
Dashboard Design
Insights & Recommendations
Data Retrieving:
Download dataset from Kaggle
Import into Power BI
Verify data structure
2. Data Cleaning in power Query:
Handle missing values
Correct data types
Rename columns
Add Calendar table
Add calculated column
3. Data Modeling
Create relationships:
Patient ↔ Appointments
Doctor ↔ Appointments
Calendar ↔ Billing
Treatment Appointment
Build a logical data model
Data Analysis (DAX)
Total Revenue
Total Patients
Average Treatment
Cost
Appointment Status
AVG age
Revenue per Hospital
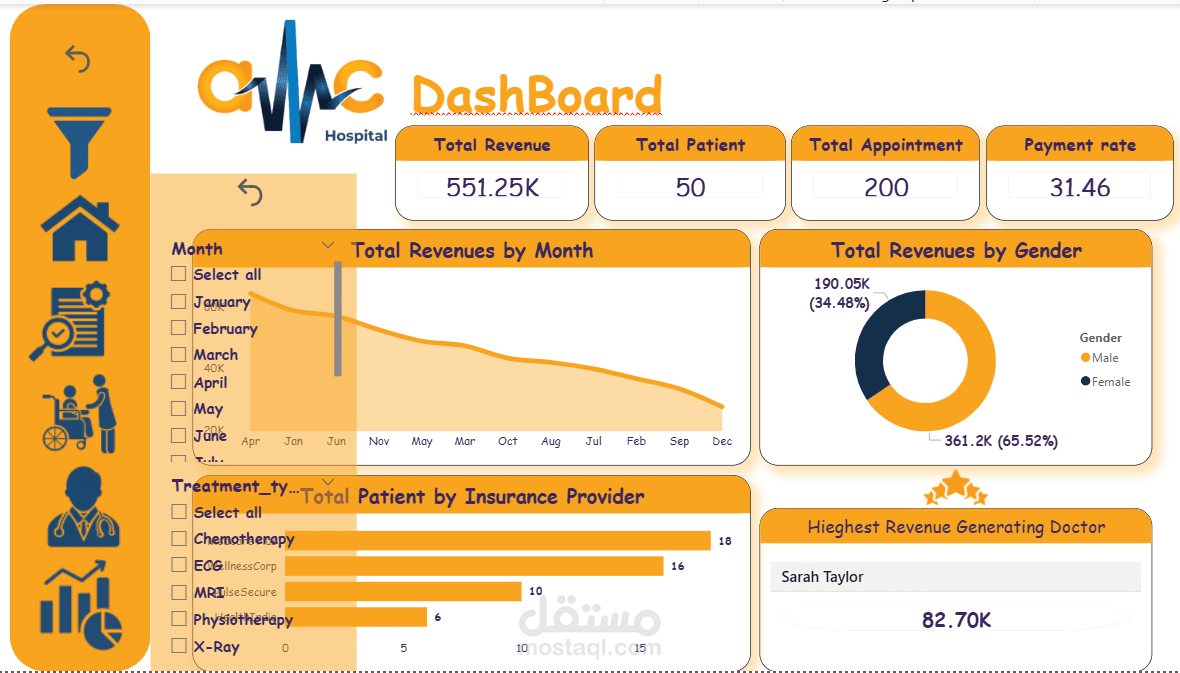
Dashboard Design
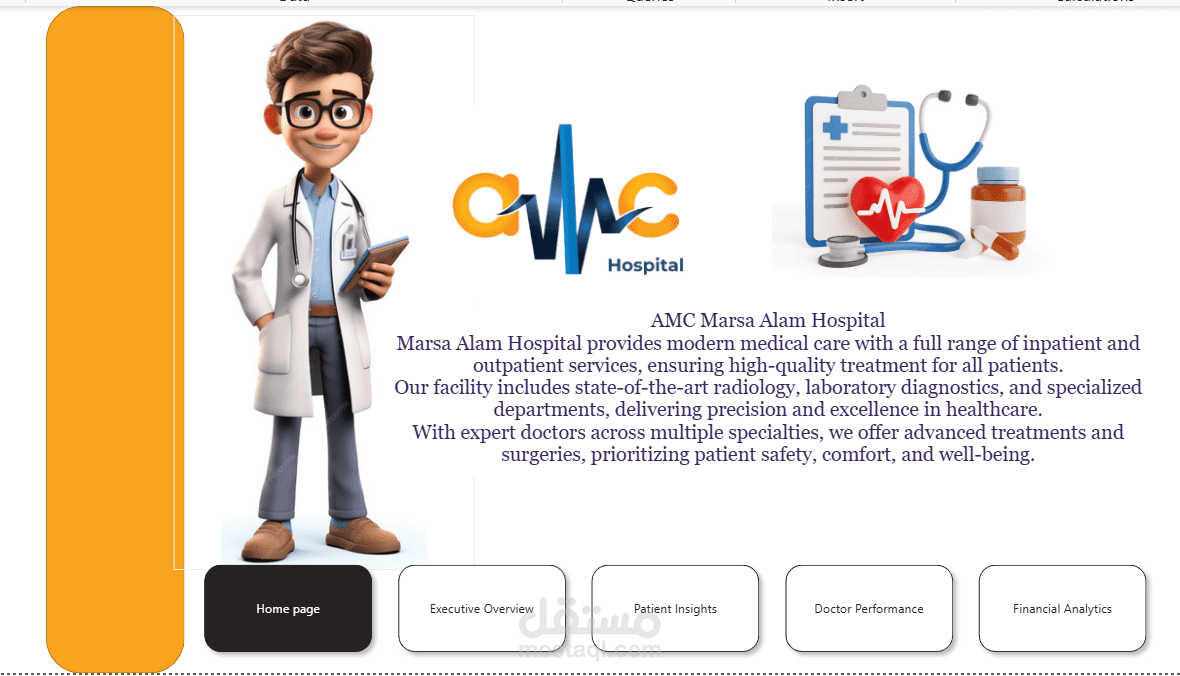
A set of key performance indicators (KPIs) has been developed to provide clear, actionable insights into overall performance. These KPIs include total Revenue, Revenue growth, Total number of appointments, and the average number of appointments per doctor.
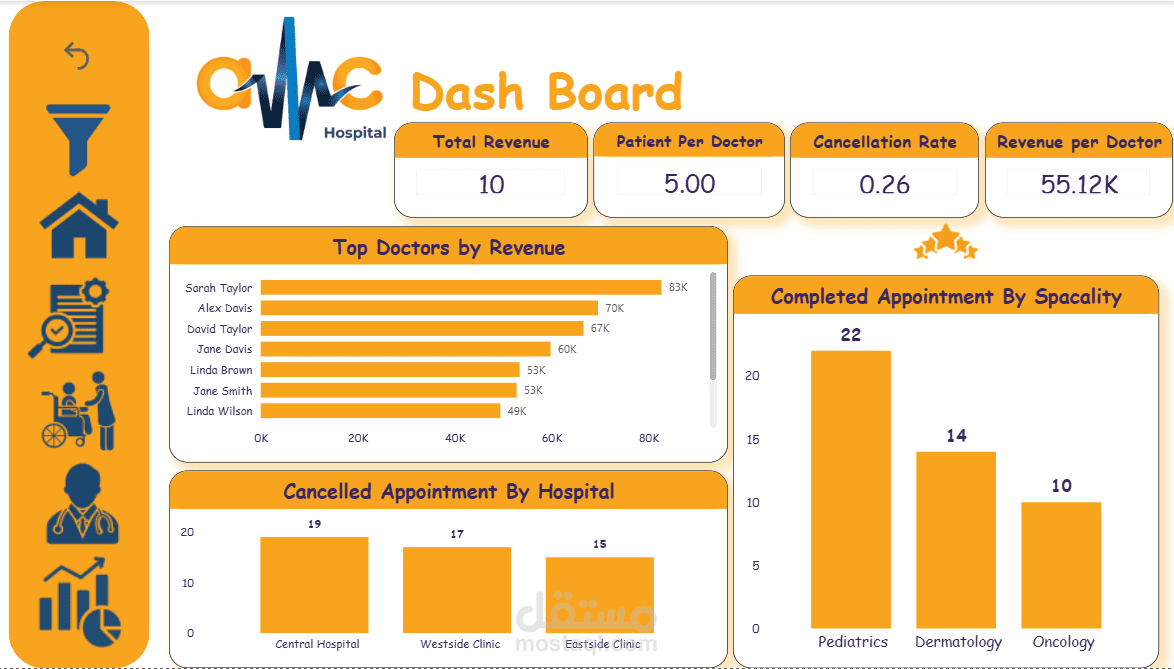
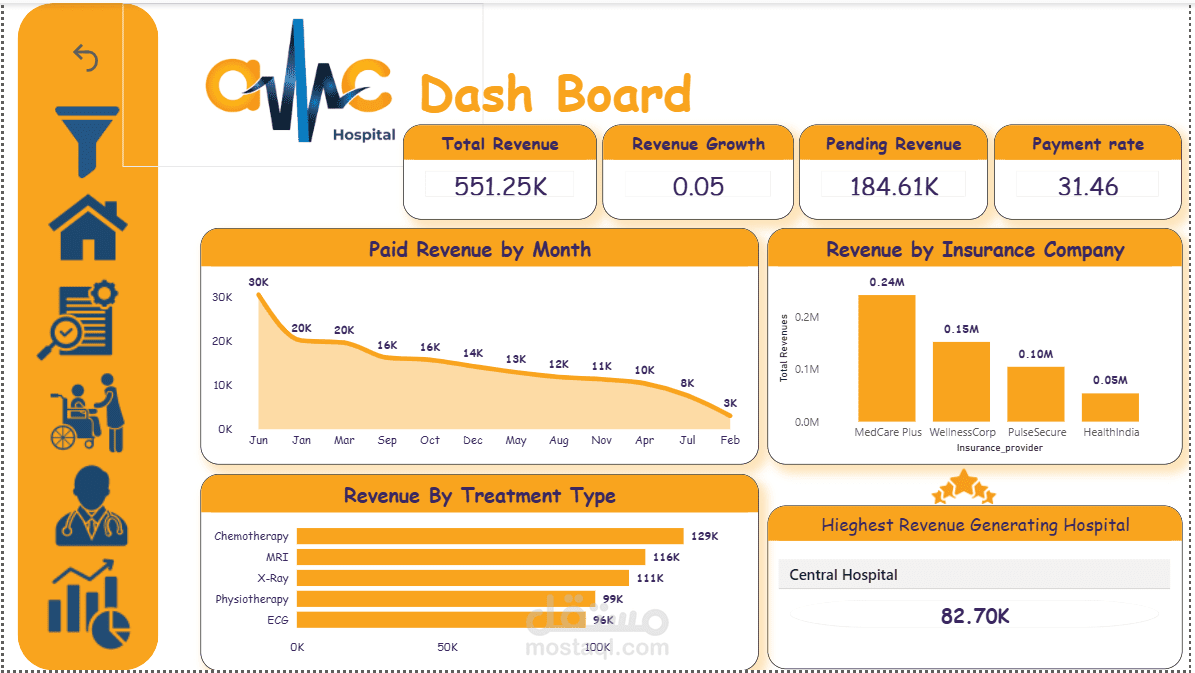
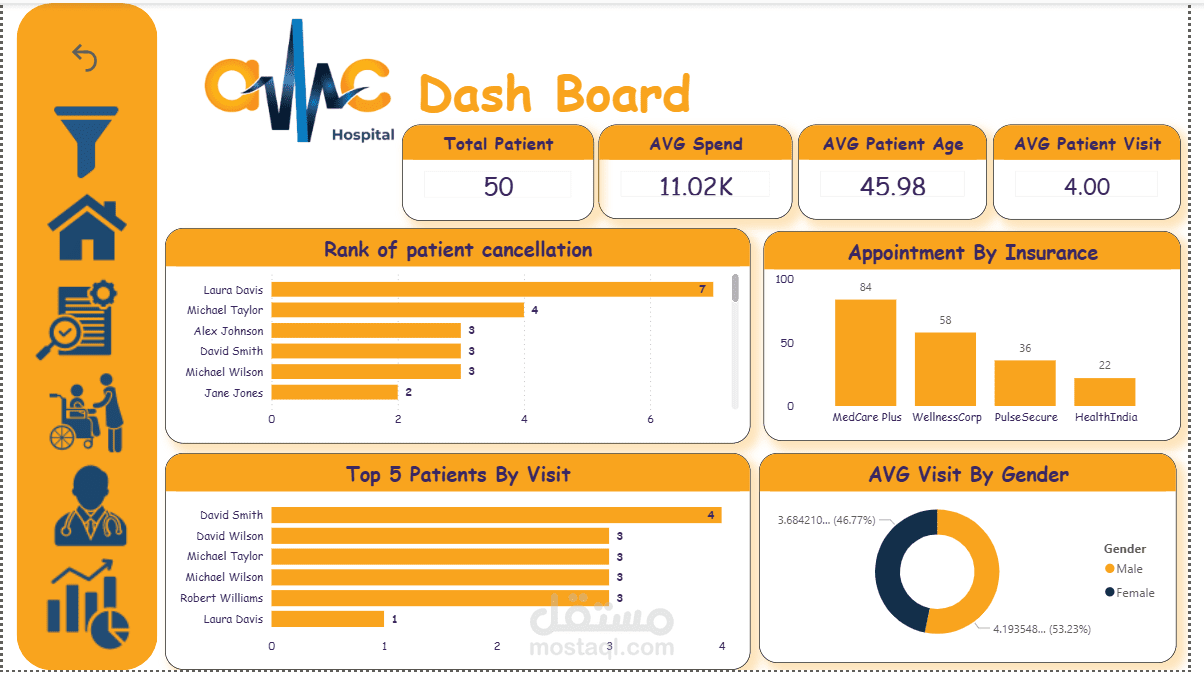
Design an interactive dashboard consisting of five key pages: a Home, Executive Overview, Doctor Performance, Patient Insights, and a Financial Analytics, with dynamic filters for date ranges and treatment types
Key Insights & Recommendations
High Appointment Cancellation pattern
Certain departments generate more revenue
Revenue is fully offset by costs, resulting in a zero-profit position
Focus on high-performing departments
Conclusion
Successfully built a Power BI dashboard
Provided actionable insights
Demonstrated full analytics workflow