Choco House Analysis
تفاصيل العمل

Dataset Description
This dataset contains synthetic retail transaction data for chocolate sales during the years 2023 & 2024 for a fictional multinational chocolate retail chain called “Choco House” operating across the United States, Canada, the United Kingdom, France, and Australia. The dataset consists of several relational tables typically used in retail analytics, including sales, products, customers, and stores.
Objective
To analyze sales, customer behavior, and product performance across multiple regions to deliver actionable insights that support data-driven decision-making and recommendations that enhance overall business profitability for Choco House.
Data Analysis Process
Power Bi & Python were used in this project to perform the following primary project steps according to the process shown below:
Data Modeling
Table Types:
Dimension tables: Products, Customers, Stores, Calendar, Images (Sub-table to products table)
Fact table: Sales
Relationships:
One to many relationships were used between dimension and fact tables.
Schema Type: Snowflake Schema
Measures
Below are DAX used in this project measures:
Revenue = SUM(sales[Revenue])
TotaTotal Profit = SUM(sales[Profit])
Total Products = DISTINCTCOUNT(products[product_id])
Total Customers = DISTINCTCOUNT(customers[customer_id])
Total Active Customers = DISTINCTCOUNT(sales[customer_id])
Cities = DISTINCTCOUNT(stores[city])
Total Stores = DISTINCTCOUNT(stores[store_id])
Total Orders = DISTINCTCOUNT(sales[order_id])
Loyality Members = CALCULATE([Total Customers],customers[loyalty_member]="Yes")
Revenue_2023 = CALCULATE([Revenue],'calendar'[Year]=2023)
Revenue_2024 = CALCULATE([Revenue],'calendar'[Year]=2024)
YOY Growth % = DIVIDE([Revenue_2024]-[Revenue_2023],[Revenue_2023],0)
AVG_Revenue = DIVIDE([Revenue],[Total Stores],0)
AVG Orders = DIVIDE([Total Orders],[Total Stores],0)
AVG Profit % = AVERAGE(sales[Profit_%])
AVG Join Period = AVERAGE(customers[Join_Period])
AVG Weight = AVERAGE(products[weight_g])
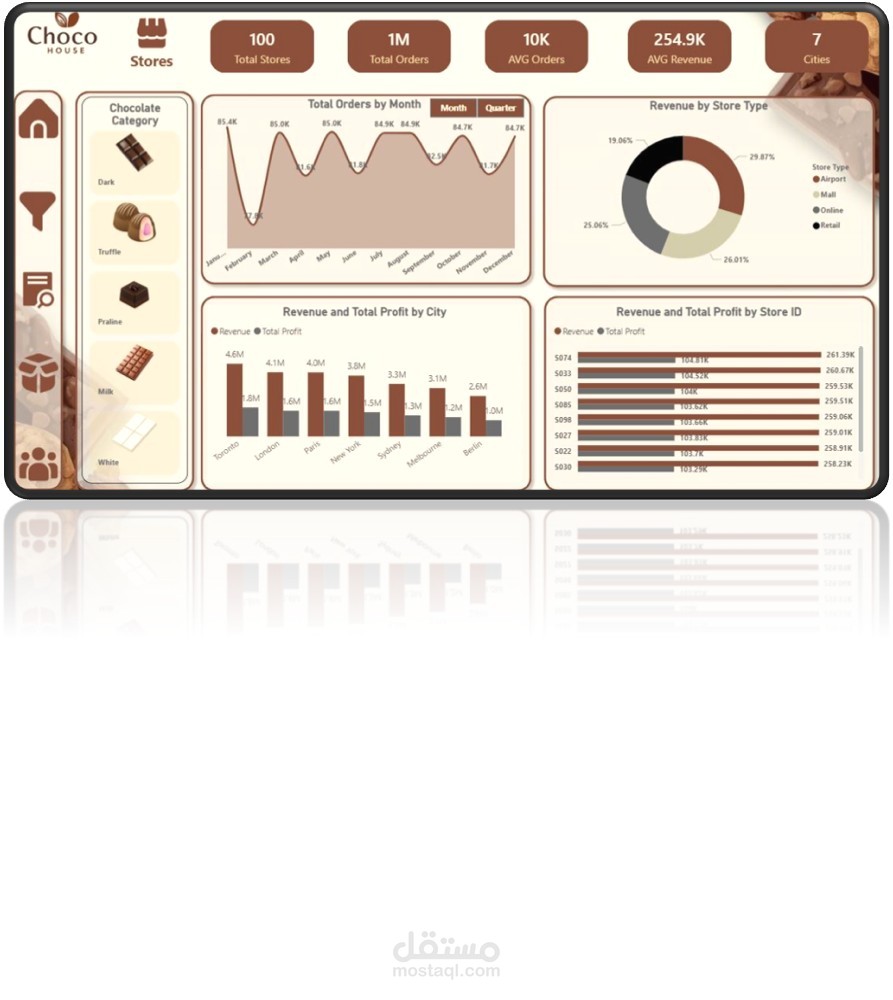
Insights
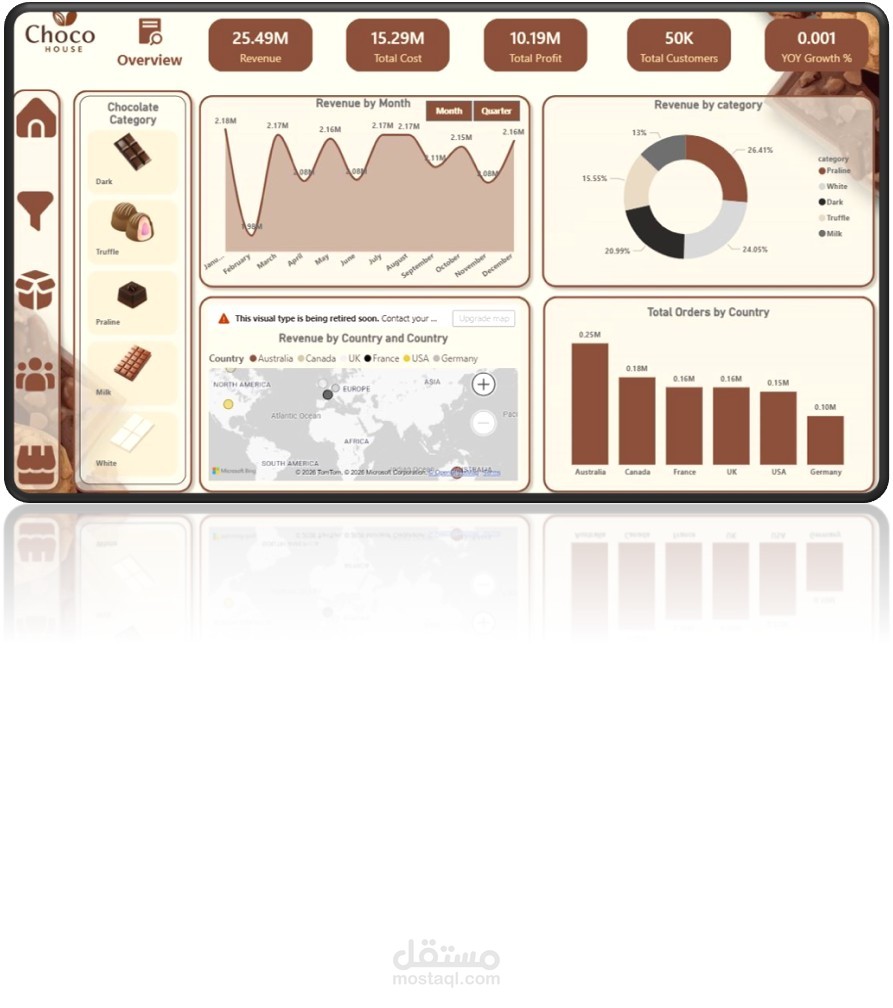
Almost no YOY growth achieved in 2024.
Very close revenue trends across in 2023 & 2024.
February is by far the lowest month by revenue in both 2023 & 2024 across all countries.
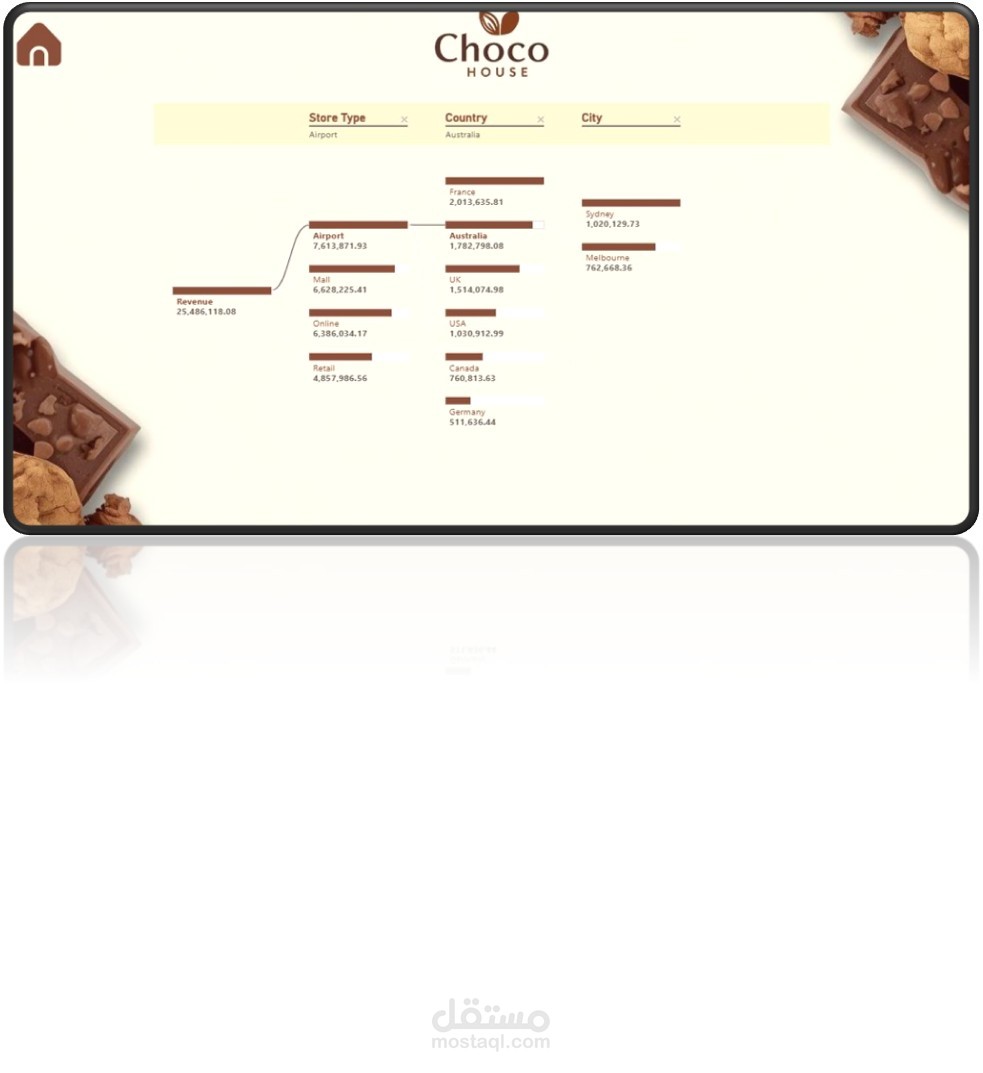
USA generates the 2nd lowest number of orders, and 2nd lowest revenue with very low stores count (15 stores)
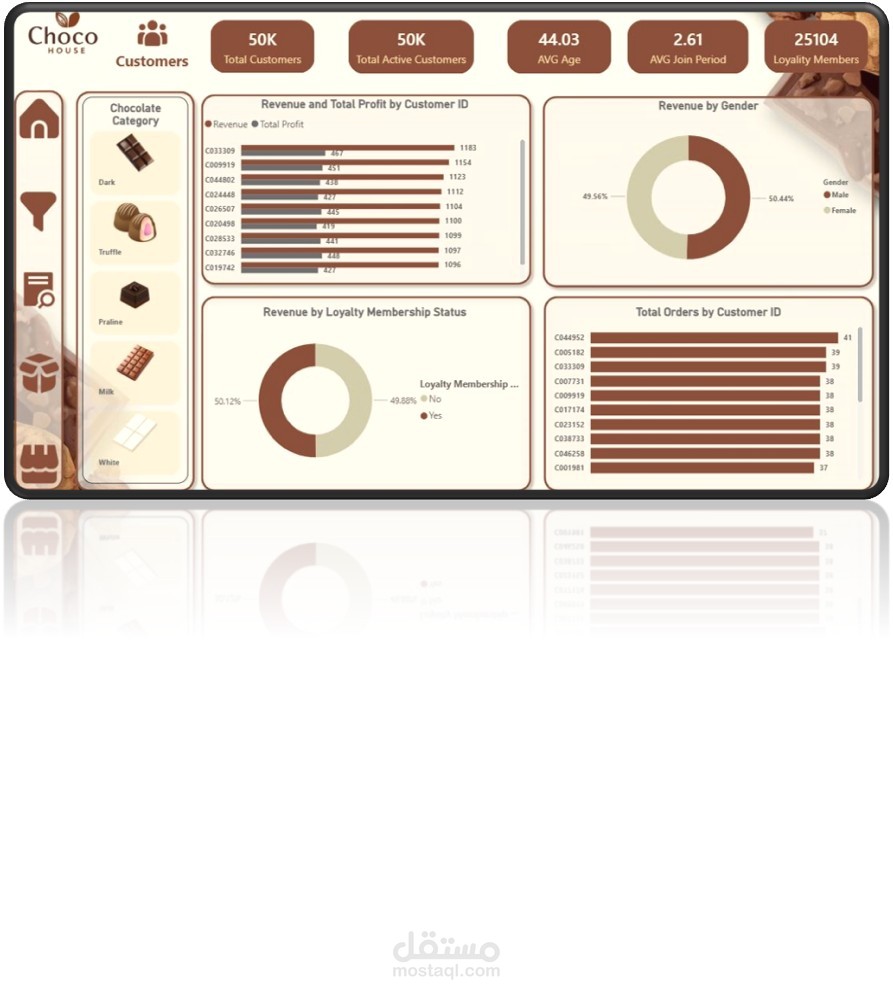
Top customers in terms of orders count don’t generate the highest revenues.
Loyalty Membership almost has no impact on revenue.
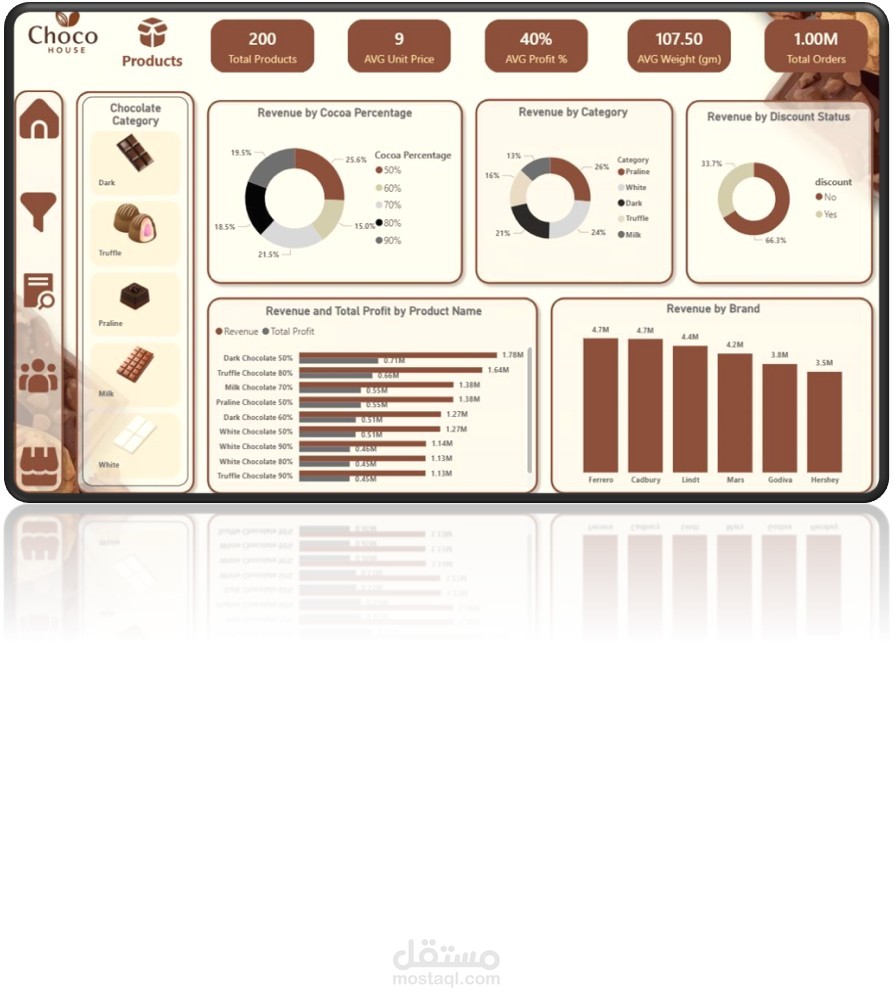
Discounted orders generate less revenue compared to undiscounted ones.
Recommendations
Introduce Valentine’s day chocolate boxes in February and launch a marketing campaign 30 days before 14th of February.
Open 10 more stores in strategic locations across USA.
Offer the top ten customers by orders count a 10% discount on big quantities of expensive products.
Don’t offer loyalty membership to new customers.
Only apply discounts on high revenue/high profit orders with larger quantities.