Marketing Analytics Dashboard
تفاصيل العمل
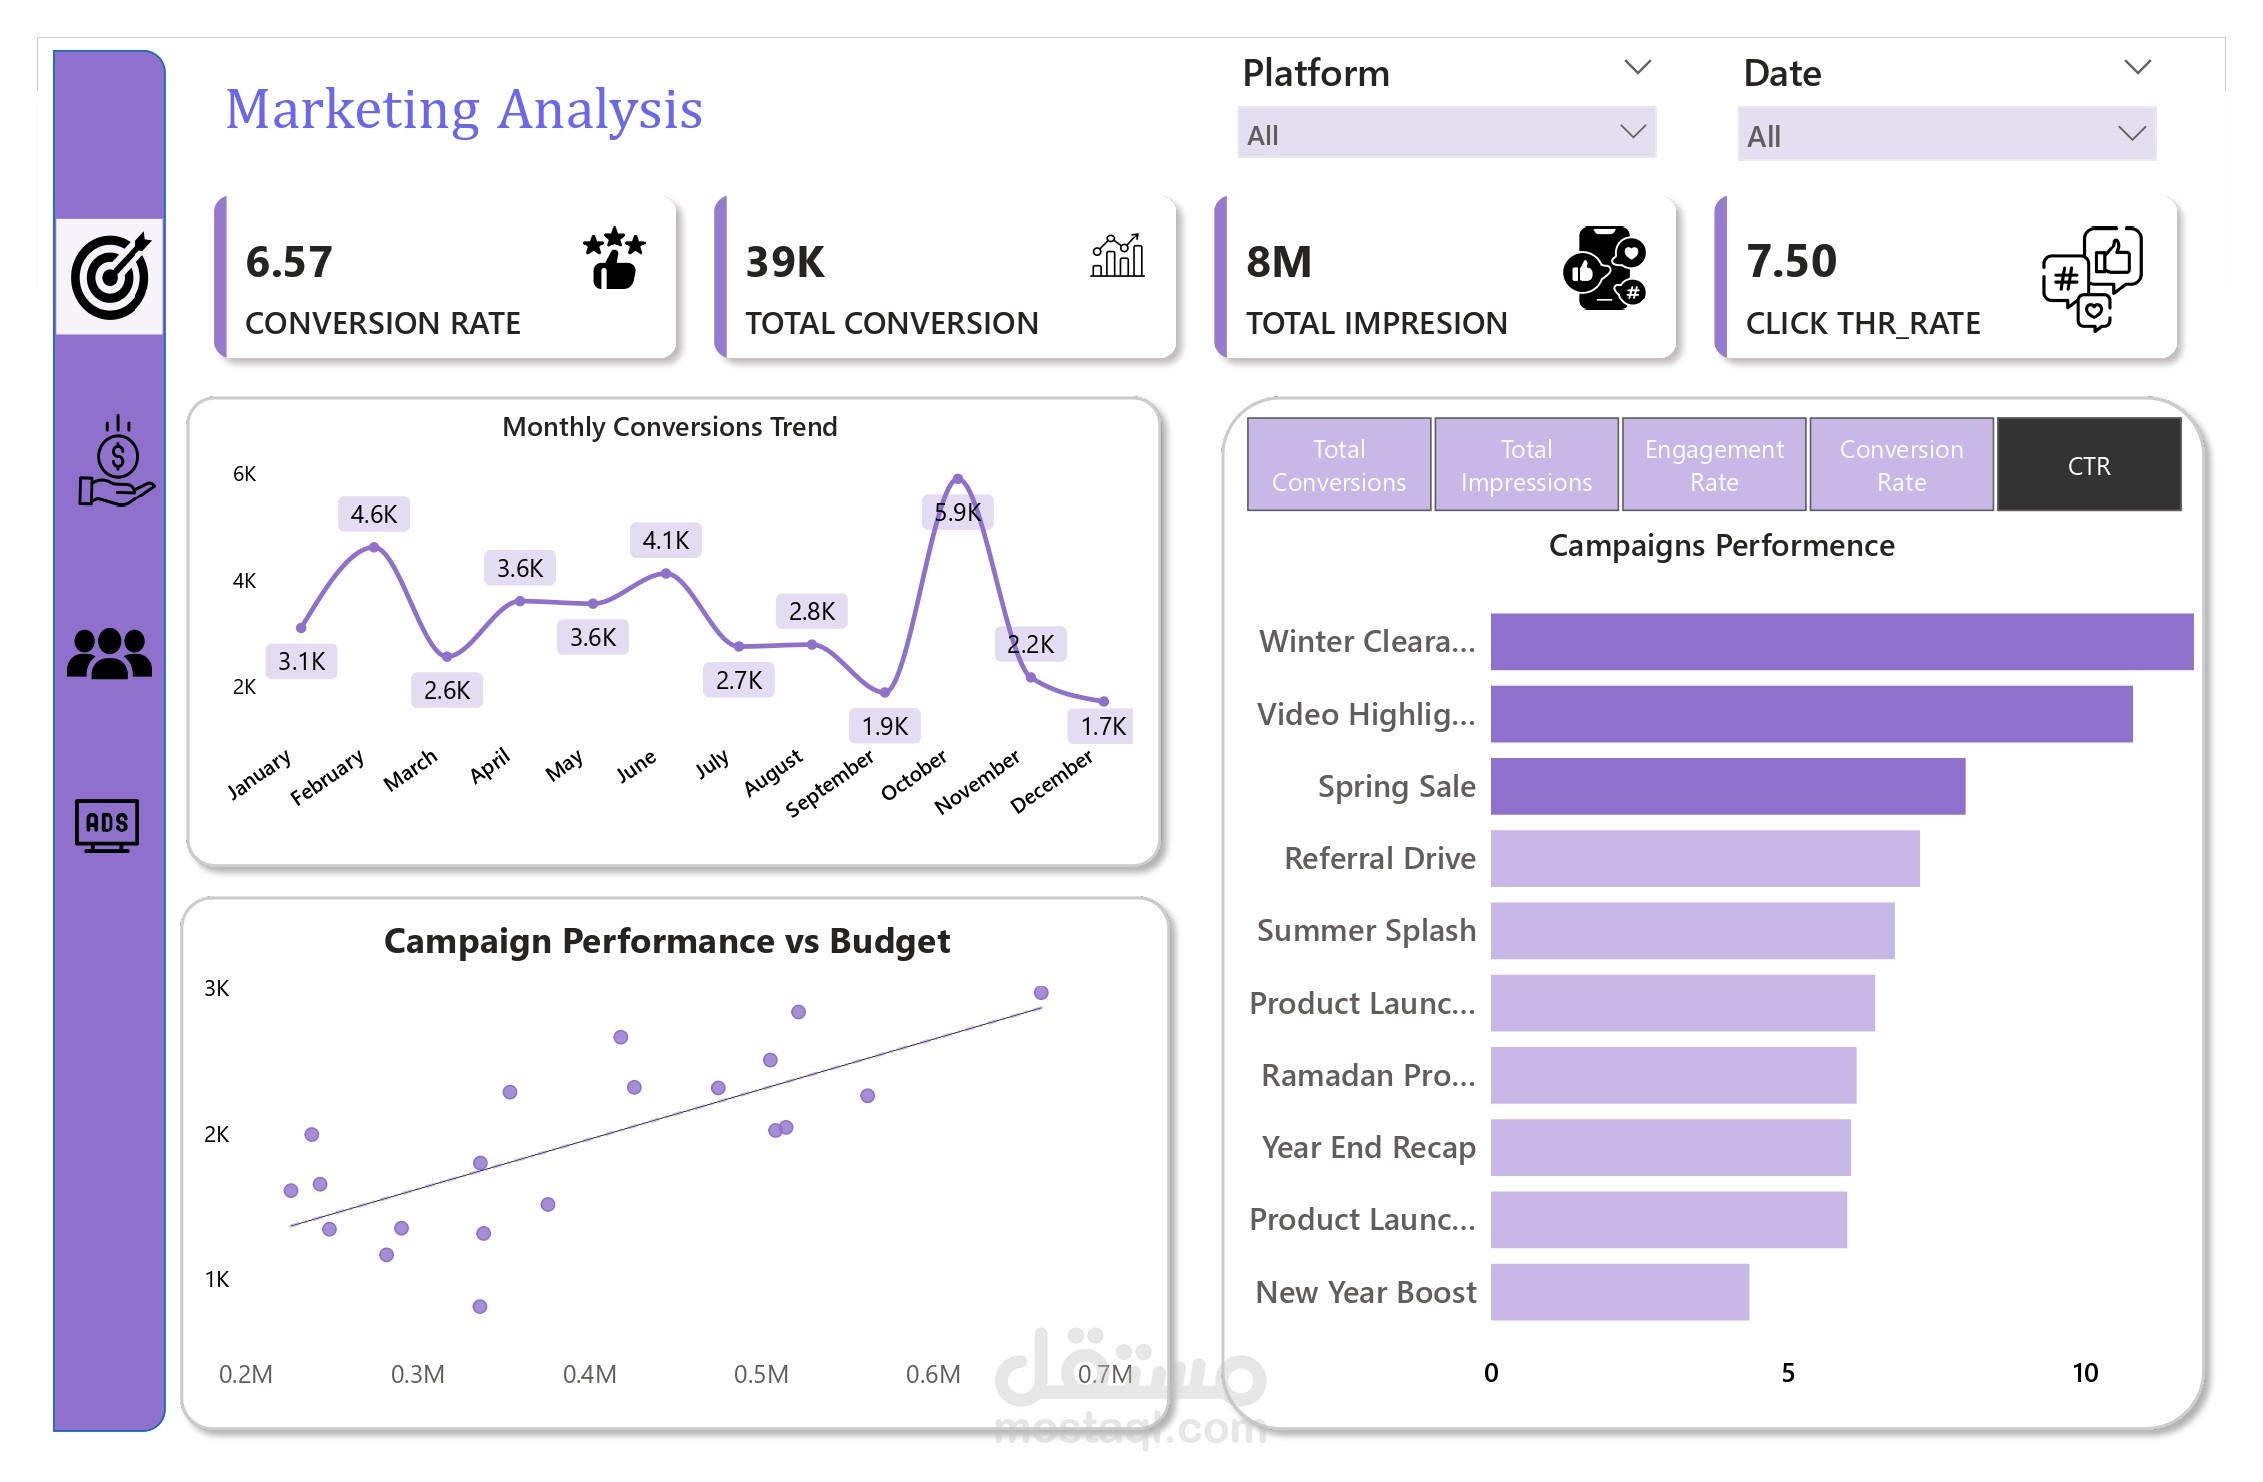
Designed and built a 4-page interactive Power BI dashboard analyzing 20 marketing campaigns across Facebook, Instagram, and TikTok, with a total ad spend of 508K and 8M+ impressions.
Engineered DAX measures for 10+ marketing KPIs including ROI, CPC, CPA, CTR, Conversion Rate, Engagement Rate, and Budget Utilization, enabling cross-platform performance comparison.
Structured the report around four business lenses — Budget & Cost, Campaign Performance, Audience Insights, and Ad Creative — connected by a custom sidebar navigation and synchronized Platform/Date slicers.
Built advanced visuals including a metric-switching bar chart (5 KPIs via button navigation), scatter plot with trend line for Campaign Performance vs Budget, and bubble chart for Campaign Duration vs Conversions.
Delivered geographic audience analysis across 6 MENA cities (Cairo, Alexandria, Riyadh, Jeddah, Dubai, Abu Dhabi) segmented by gender, age, and platform.