EcoTrack
تفاصيل العمل
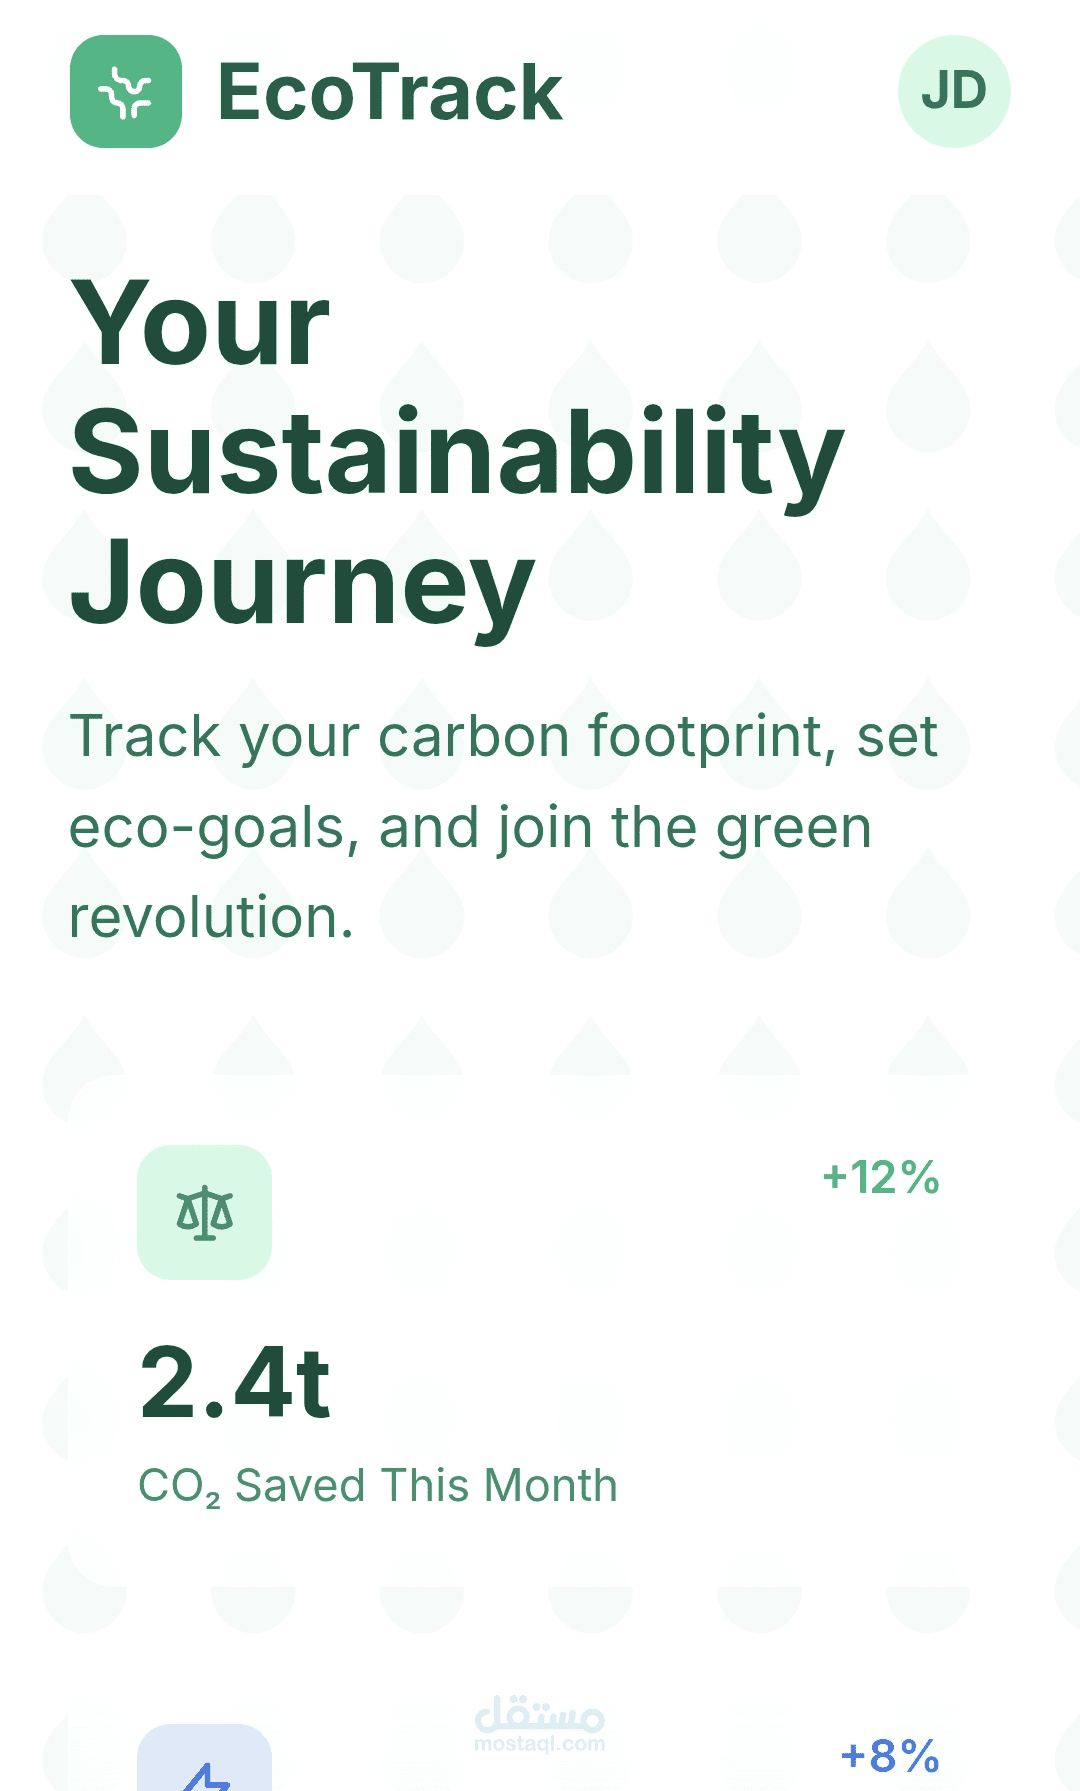
Real-time stat cards showing CO₂ saved, clean energy usage, money saved, and eco points
Interactive charts (powered by Chart.js) — a line chart for carbon footprint trends and a doughnut chart for energy source breakdown
Animated progress bars for active eco-goals (plastic reduction, plant-based meals, public transport)
Glassmorphism UI with backdrop blur effects and soft green gradients
Floating leaf pattern background and smooth hover animations