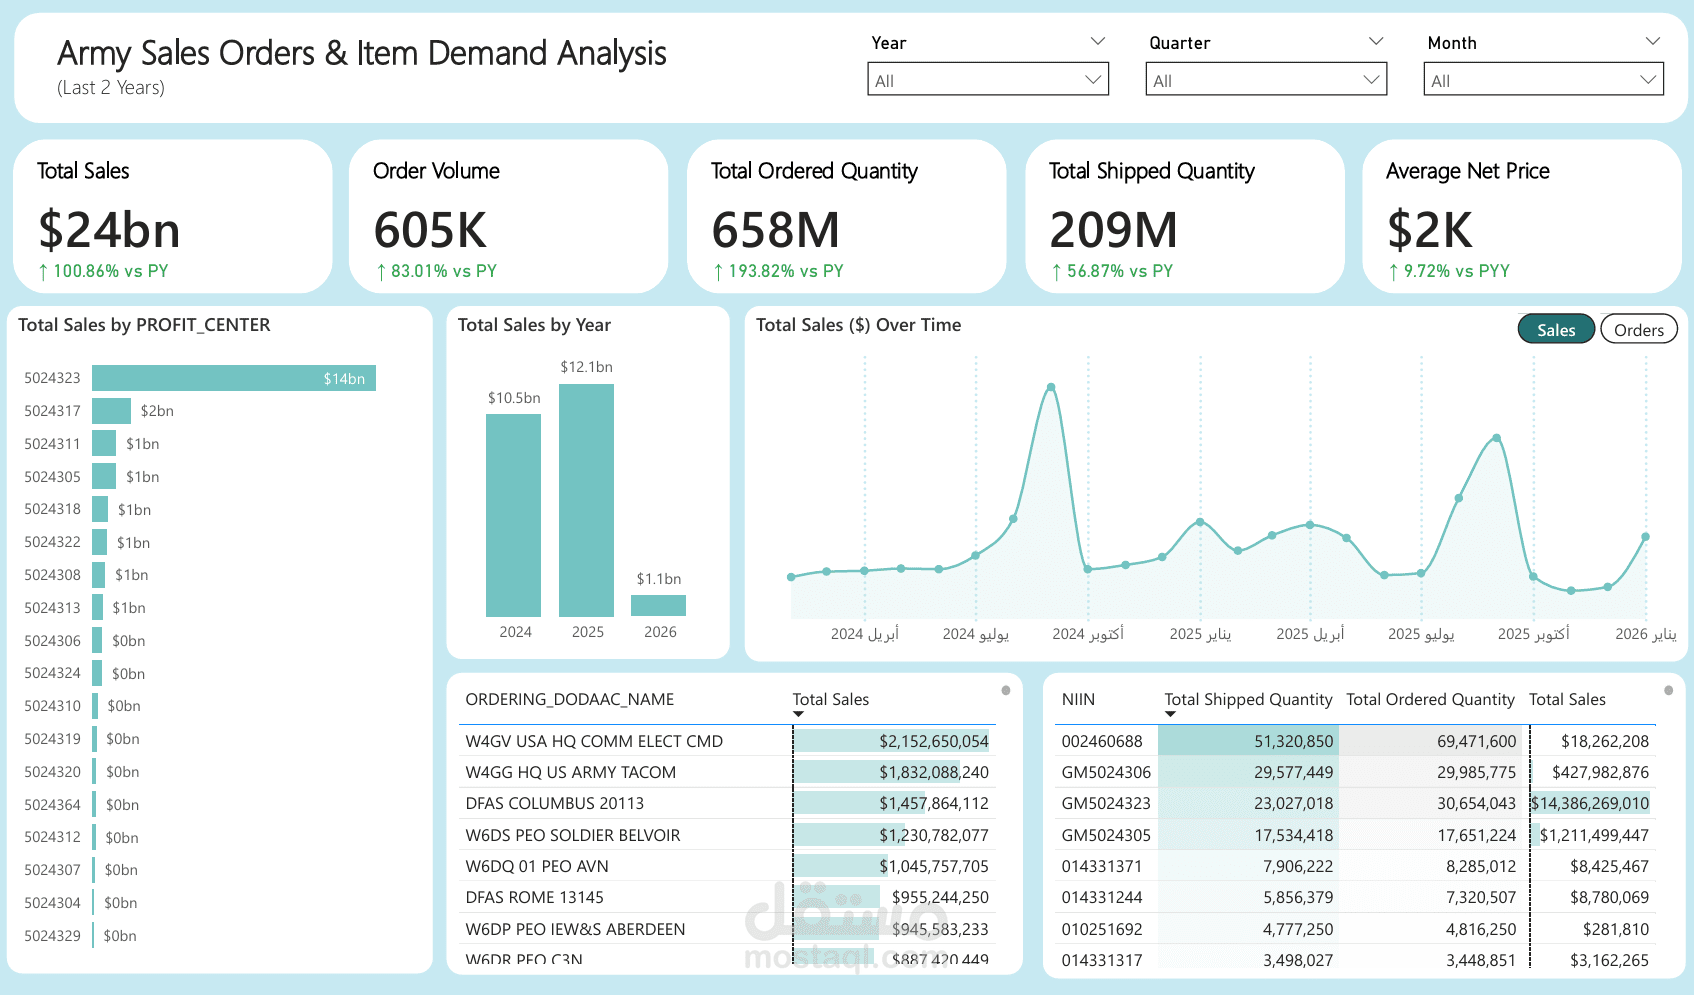
Sales Orders & Item Demand Analysis
تفاصيل العمل
🎯 Problem Statement
/ BUSINESS CHALLENGE
The US Army procurement division lacked unified visibility into $24bn in sales. Data was fragmented across profit centers with no clear view of the growing fulfillment gap.
📁 Data Overview
/ DATASET
605,000+ sales orders, 658M ordered units, and 209M shipped entries processed from government ERP systems over a 2-year period.
⚙️ Process
/ HOW IT WAS BUILT
Built a star schema in Power BI with custom DAX for YoY variance and profit center drill-throughs. Created a 'Sales vs. Orders' toggle to visualize demand spikes.
💡 Key Insights
/ FINDINGS
A critical fulfillment gap was identified: 193.82% YoY growth in ordered quantity vs. only 56.87% in shipped quantity. One profit center drove 58% ($14bn) of total revenue.
📈 Business Impact
/ RESULTS
$24bn
Total Sales
193%
Order Growth
56.8%
Shipment Growth
Power BI
DAX
Star Schema
Supply Chain