Retail Sales Analytics — 7,000+ transactions across 5 datasets
تفاصيل العمل
## 📌 Project Overview
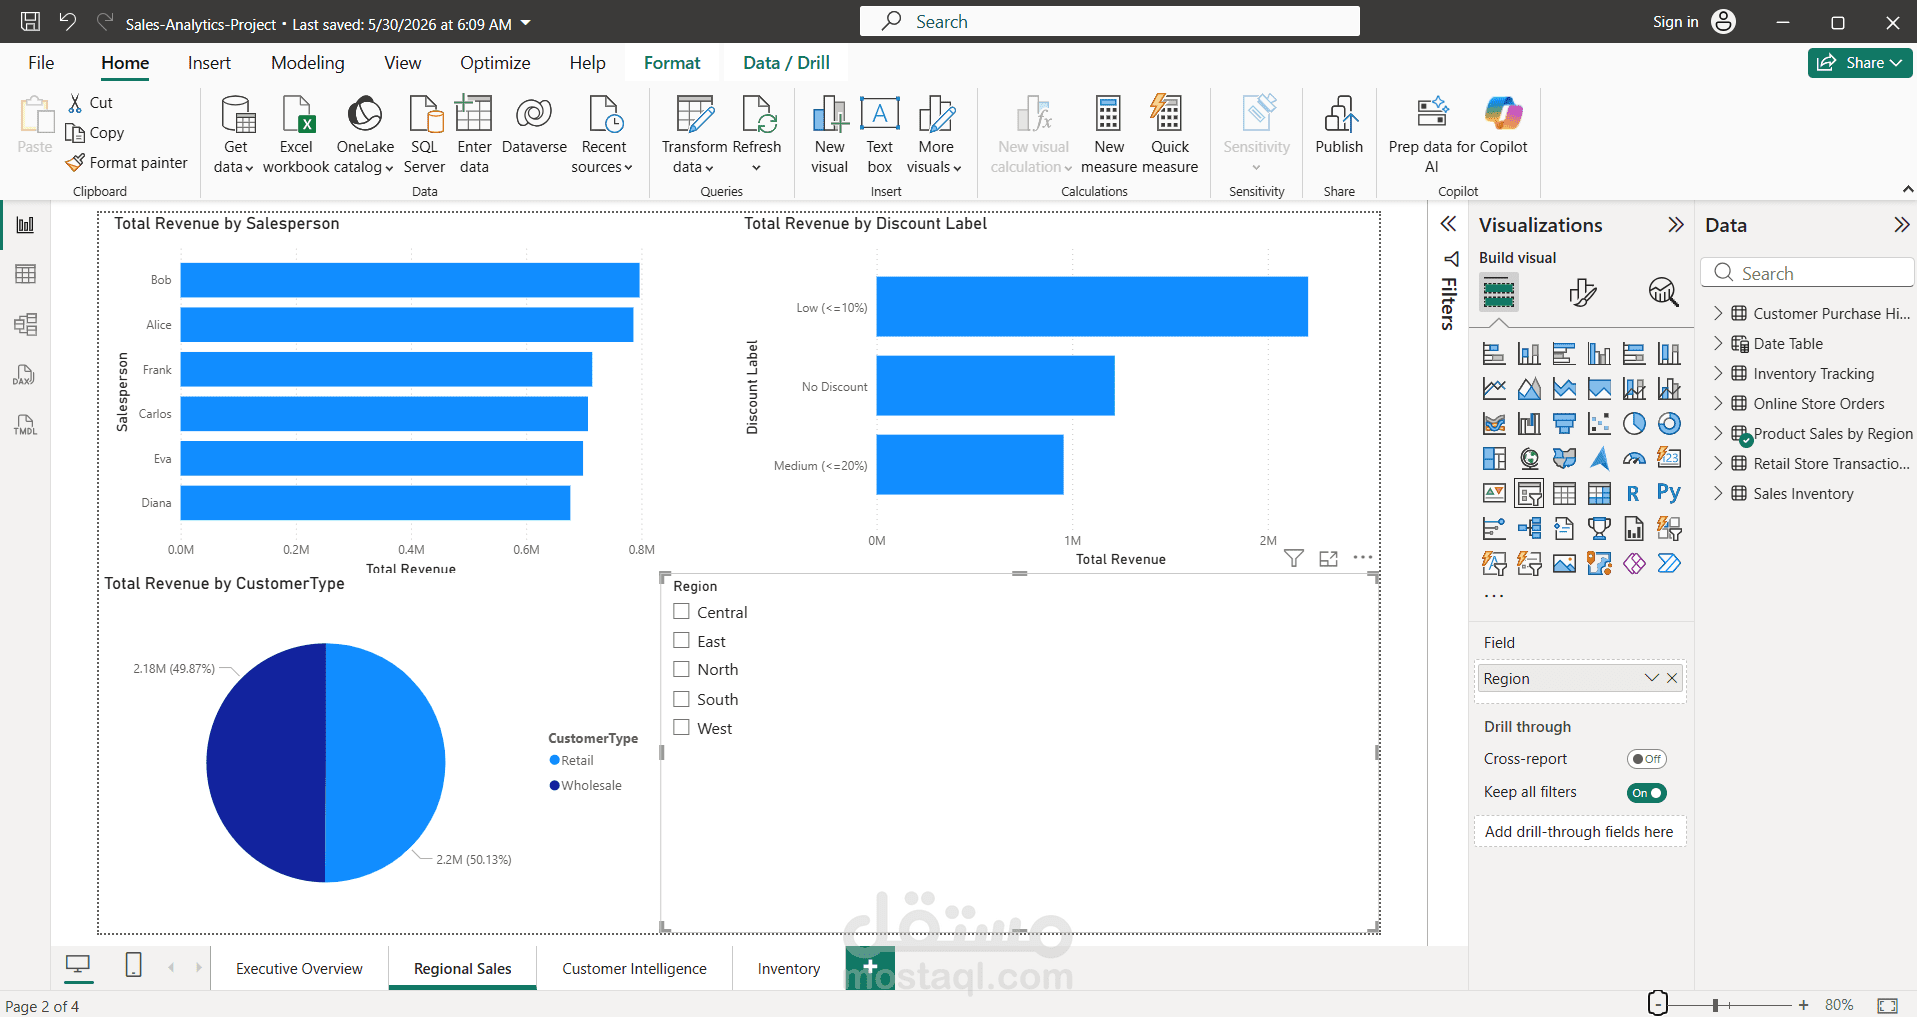
A full end-to-end sales analytics project built with **Power Query** and **Power BI**, covering data cleaning, modeling, DAX measures, and interactive dashboards across 5 real-world datasets.
---
## 📂 Datasets Used
| File | Rows | Description |
|------|------|-------------|
| Product-Sales-Region.xlsx | 1,500 | Regional sales transactions |
| Online-Store-Orders.xlsx | 1,200 | E-commerce orders |
| Retail-Store-Transactions.xlsx | 2,000 | In-store transactions |
| Customer-Purchase-History.xlsx | 1,800 | Customer purchase records |
| Inventory-Tracking.xlsx | 500 | Stock and supplier data |
**Total: 7,000+ rows of sales data**
---
## 🔧 Tools & Skills
- **Power Query** — Data cleaning, transformation, custom columns, Merge Queries
- **Power BI** — Data modeling, DAX measures, interactive dashboards
- **DAX** — SUMX, DIVIDE, FILTER, COUNTROWS, ADDCOLUMNS, CALENDAR
---
## 🧹 Data Cleaning (Power Query)
- Changed column data types (Date, Whole Number, Decimal)
- Applied Text.Trim to remove hidden spaces from all text columns
- Replaced null values with meaningful labels:
- `Promotion` → "No Promotion"
- `CouponCode` → "No Coupon"
- Added custom calculated columns:
- `Delivery Days` = DeliveryDate - OrderDate
- `Discount Label` = Low / Medium / High / No Discount
- `Revenue Band` = Small / Medium / Large
- `Rating Label` = Positive / Neutral / Negative
- `Stock Status` = Out of Stock / Low Stock / Moderate / Well Stocked
- `Inventory Value` = QuantityInStock × UnitCost
- Merged **Product Sales** with **Inventory Tracking** via Product key