E-Commerce Sales Dashboard | Excel Project
تفاصيل العمل
🔹 Project Workflow:
• Data Cleaning & Preparation
• Data Validation and Formatting
• Building Pivot Tables and Pivot Charts
• Creating Interactive Slicers
• Dashboard Design and Visualization
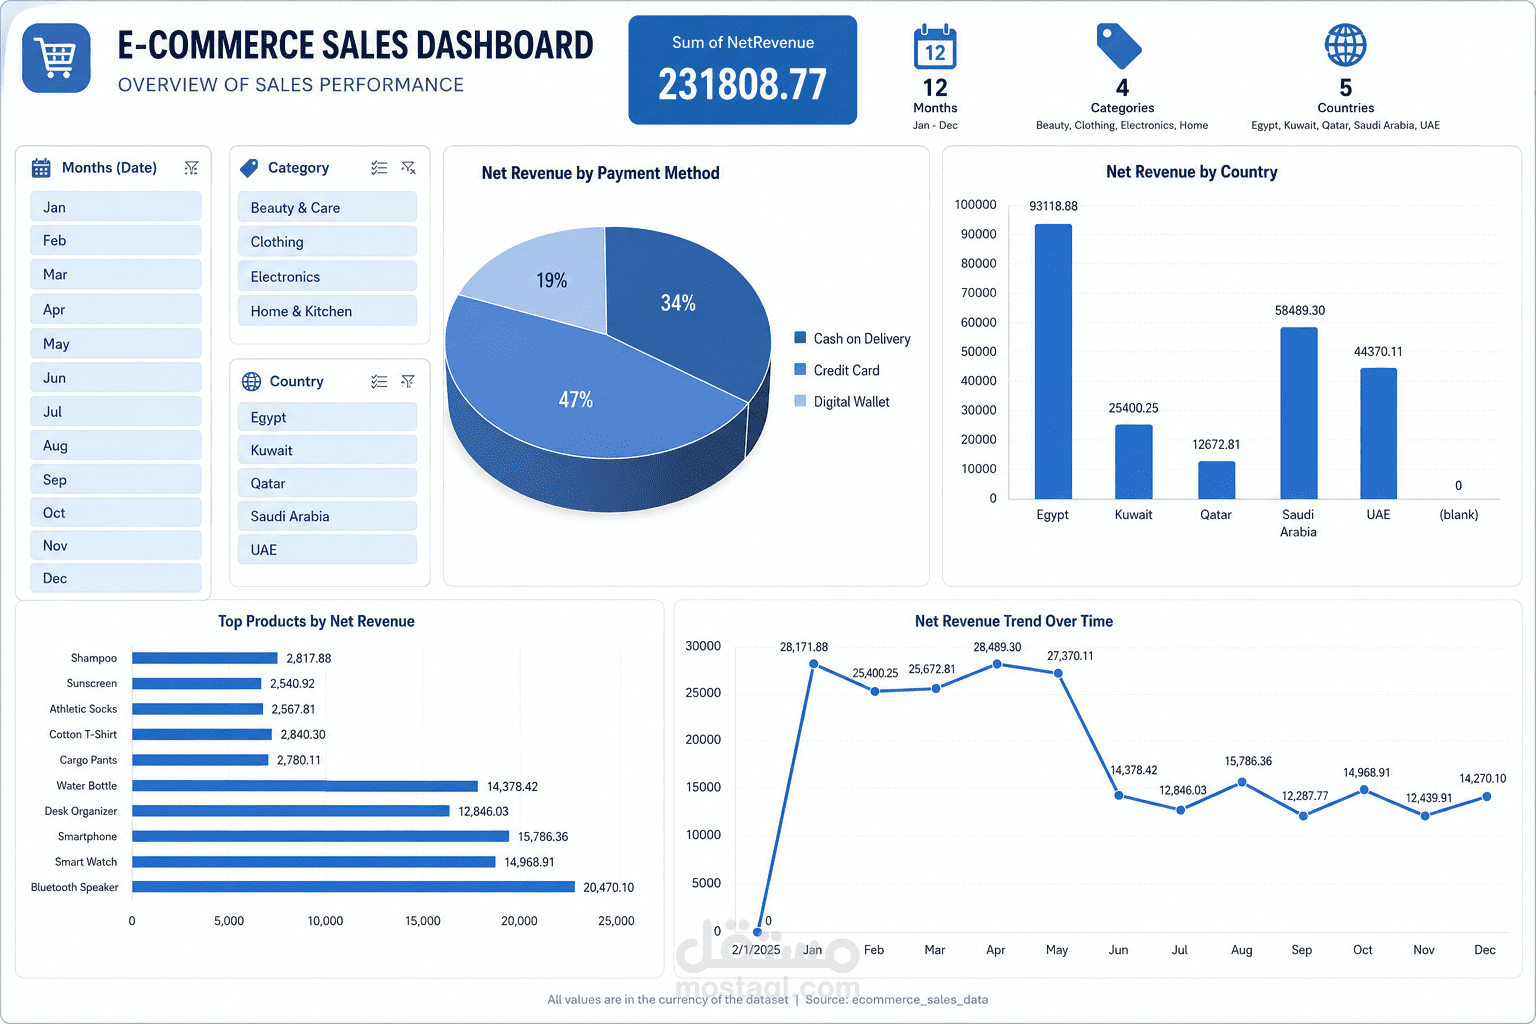
🔹 Key Insights:
• Total Net Revenue Analysis
• Sales Performance Across Different Countries
• Payment Method Distribution
• Monthly Revenue Trends Throughout 2025
• Top-Performing Products and Categories
🛠️ Tools Used:
Microsoft Excel | Data Cleaning | Pivot Tables | Pivot Charts | Slicers | Data Visualization
Through this project, I strengthened my skills in data cleaning, analysis, and dashboard creation, transforming raw sales data into meaningful insights that can support business decisions and performance monitoring.