Egypt’s real estate market
تفاصيل العمل
1️⃣ Data Cleaning & Preparation
I started by cleaning the raw dataset, handling missing values, standardizing prices and property sizes, and preparing the data for accurate analysis.
2️⃣ Exploratory Data Analysis (EDA)
Using Pivot Tables and analytical techniques, I explored the relationship between key variables such as location, price, property size, and number of rooms to uncover meaningful market insights.
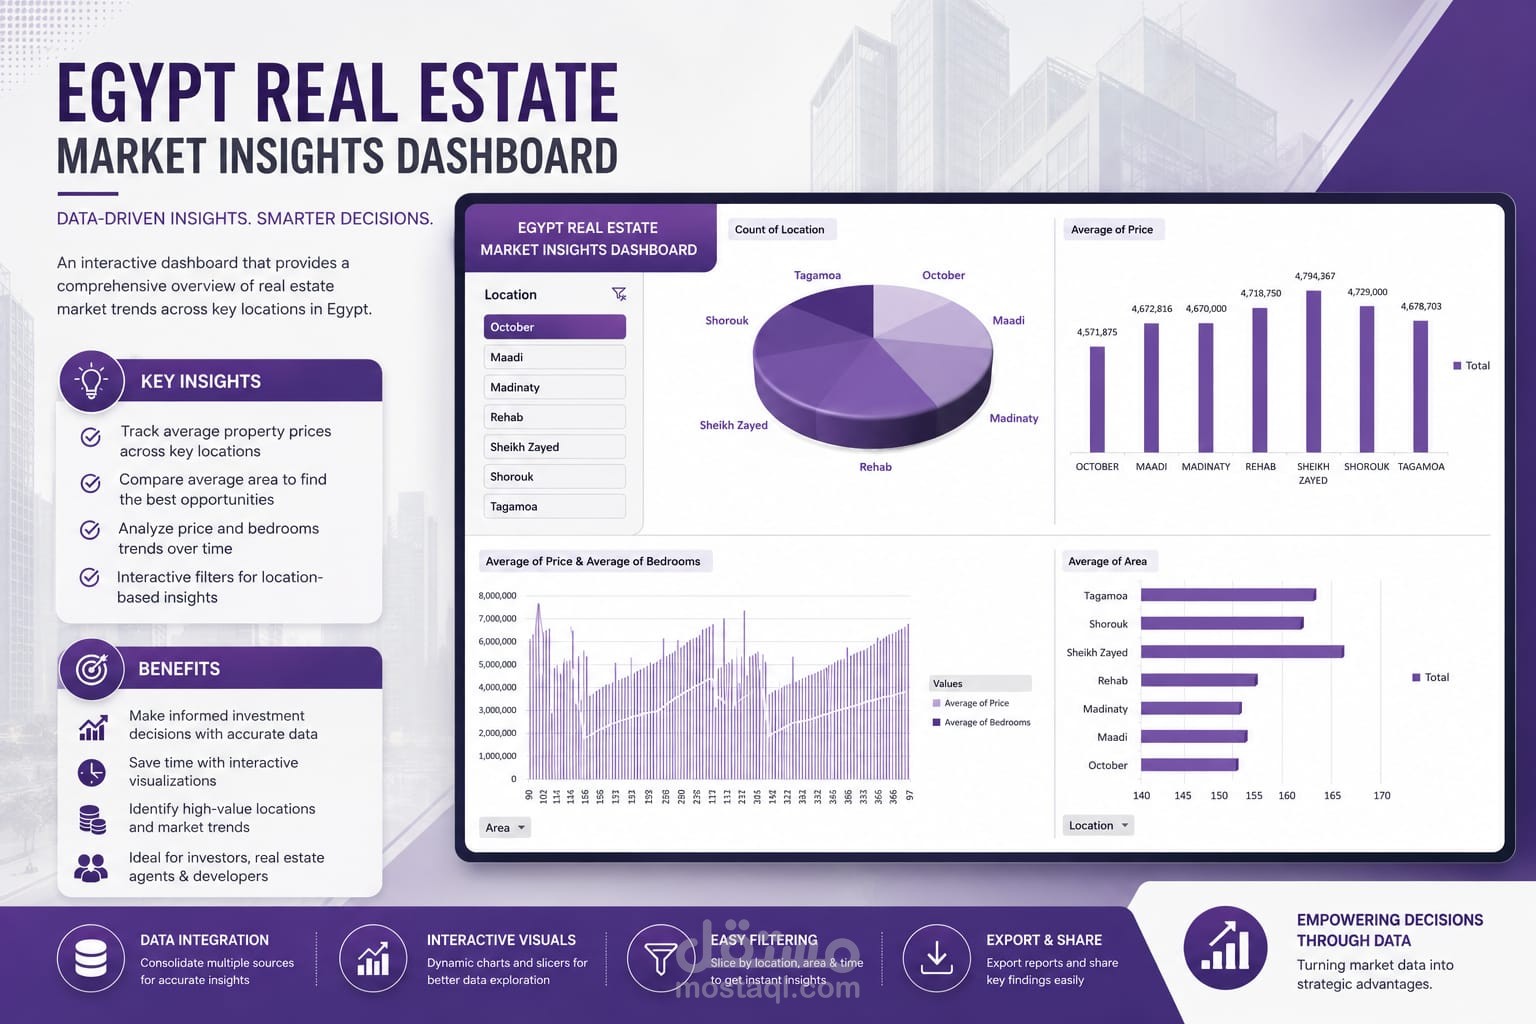
3️⃣ Interactive Dashboard Development
I designed a fully interactive dashboard using Power BI, connecting all visualizations through dynamic filters and slicers to create a smooth and insightful user experience.
💡 Key Insights from the Dashboard:
📌 New Cairo had the highest number of listed properties, followed by Madinaty and El Shorouk.
📌 Sheikh Zayed recorded the highest average property prices, while October appeared to be one of the most affordable areas.
📌 The analysis also revealed a clear positive relationship between the number of rooms and average property size across different locations.
One of the most rewarding parts of data analysis is transforming raw numbers into interactive stories that support smarter decisions and reveal hidden patterns. 📊💻