full-year sales analysis project for “Cozy Bean Coffee Shop”
تفاصيل العمل
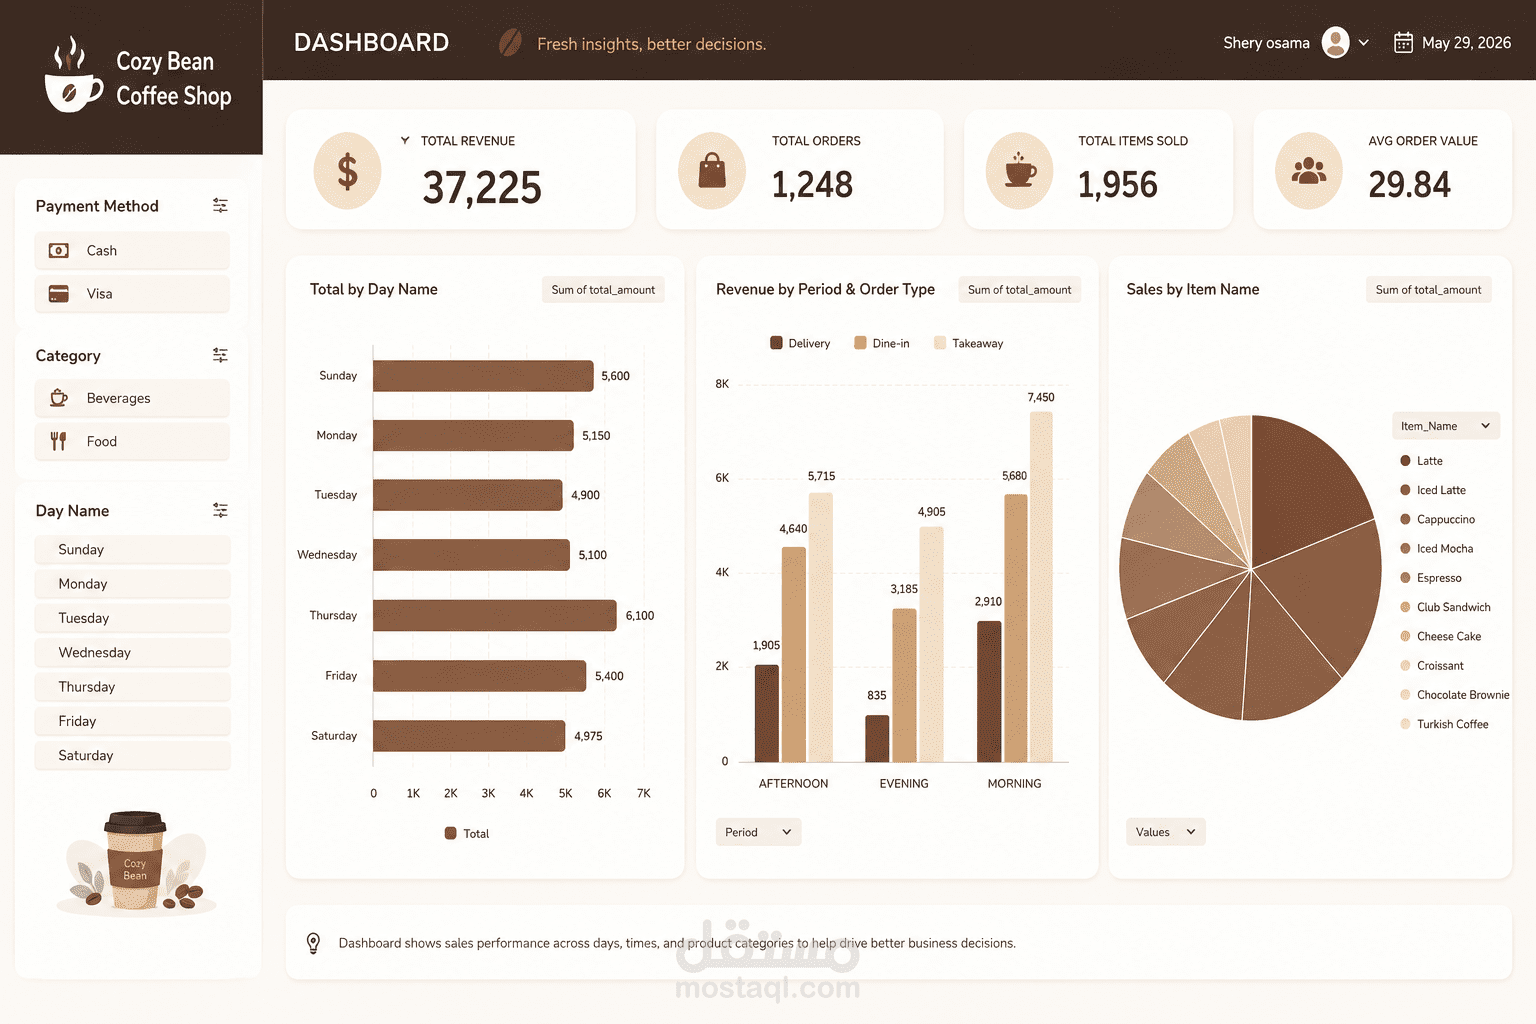
The dashboard includes:
• Interactive slicers for dynamic filtering
• KPI Cards for quick performance tracking
• Well-structured charts and visual storytelling for easier decision-making
Key Business Insights:
☕ Top-Selling Products:
Both Latte and Iced Latte generated over 38% of total sales revenue, making them the strongest products for promotional campaigns and upselling strategies.
📈 Peak Sales Days:
Thursday recorded the highest weekly sales performance, followed by Friday and Sunday, indicating strong customer activity before weekends.
🌅 Operational Time Analysis:
The Morning period showed the highest number of orders, especially for Takeaway and Dine-in services, while evening sales were noticeably lower — highlighting a potential opportunity for evening promotions or “Happy Hour” offers.
This project was a great opportunity to strengthen my skills in:
• Data Cleaning & Preparation
• Data Analysis
• Dashboard Design
• Business Insight Extraction
• Interactive Reporting in Excel