Bank Dashboard
تفاصيل العمل
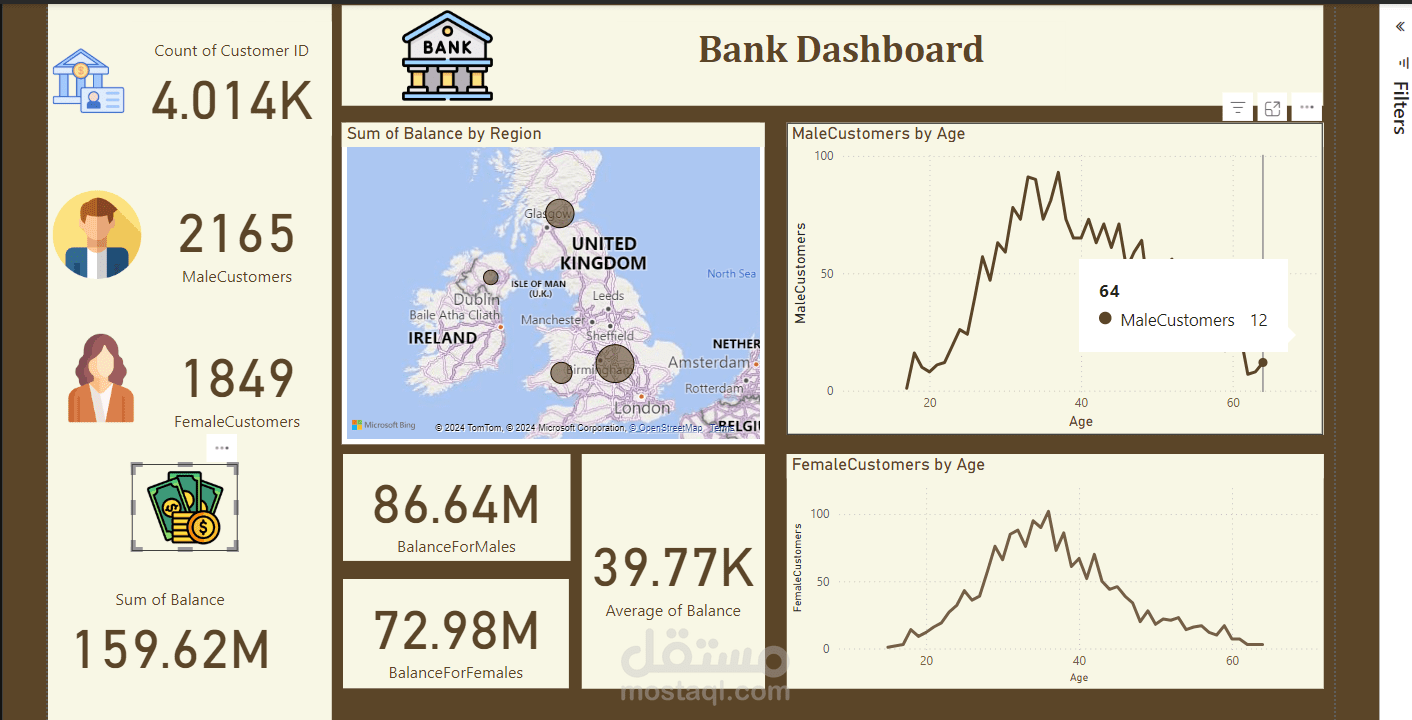
This project analyzes customer bank balances to understand how money is distributed across different demographics such as gender, job classification, and region.
Main objectives:
Study balance distribution across customer segments.
Identify trends by job type and geographic region.
Support marketing and business decision-making.
Data sources:
Customer data (ID, gender, job, region)
Balance data (account balances linked by Customer ID)
Key analyses & visuals:
Overall balance overview dashboard
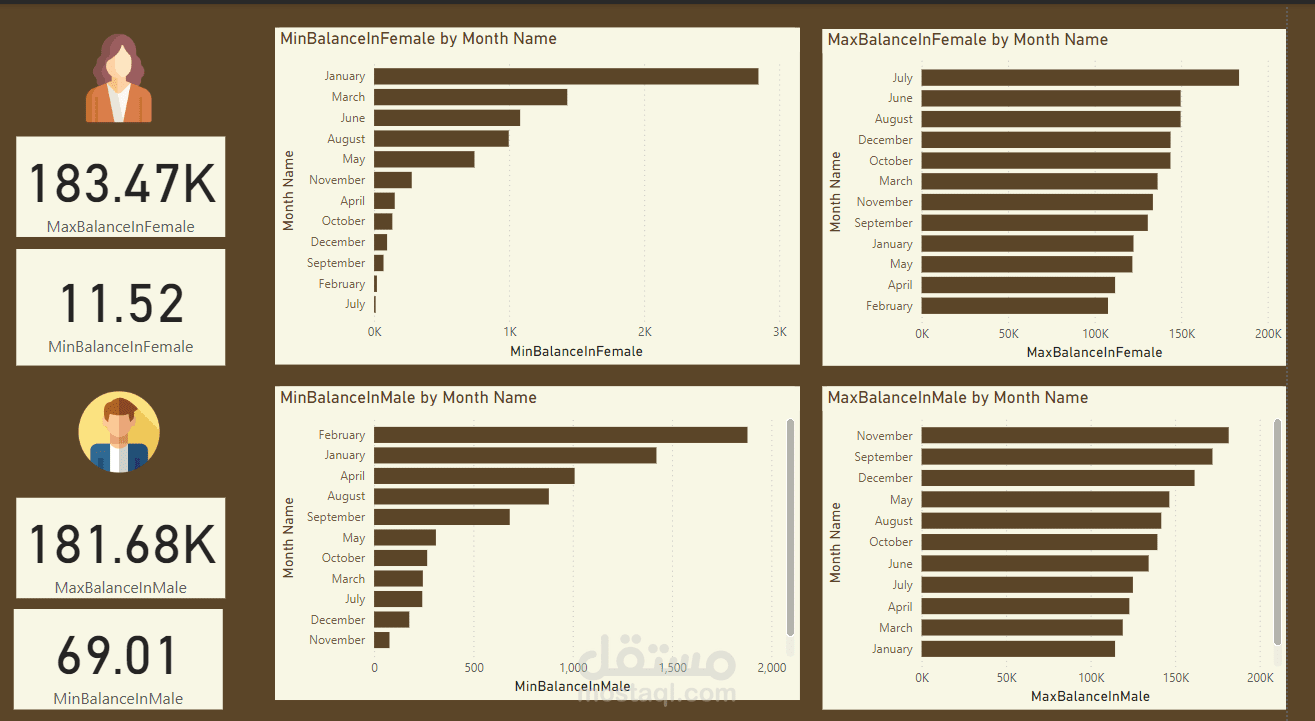
Gender-based balance distribution
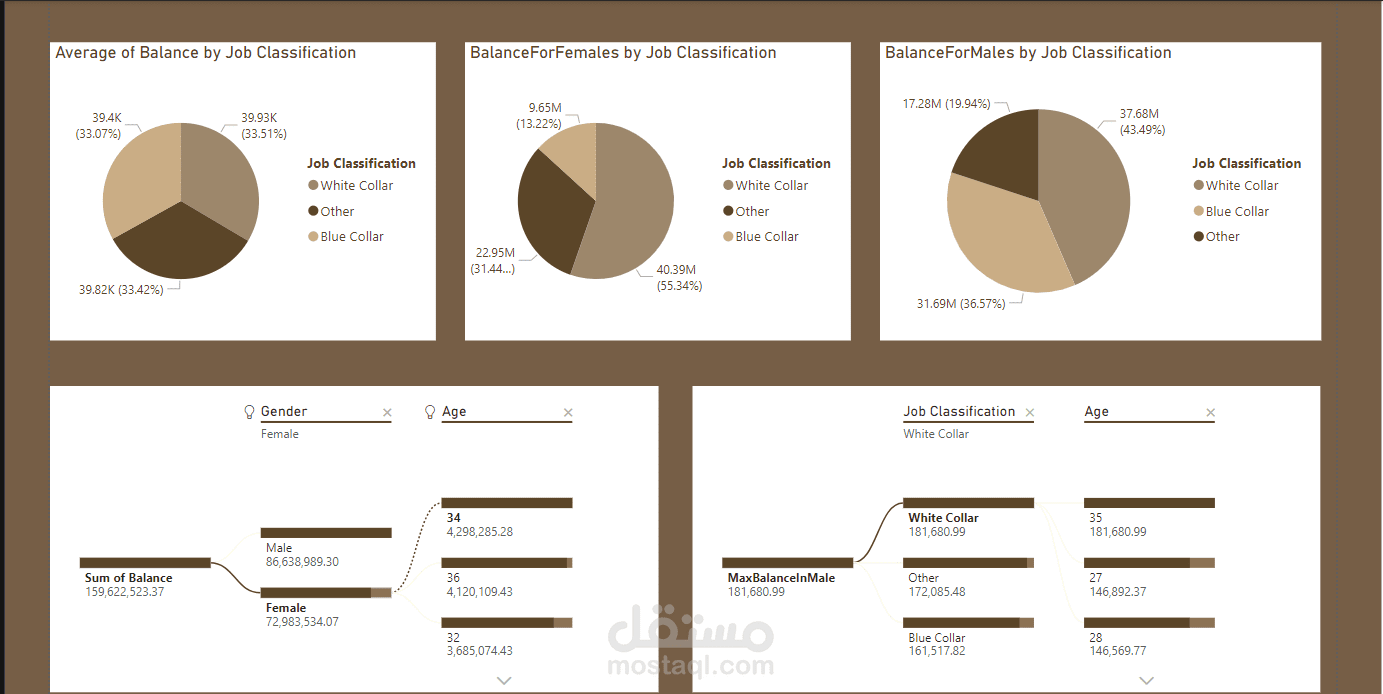
Job classification comparison
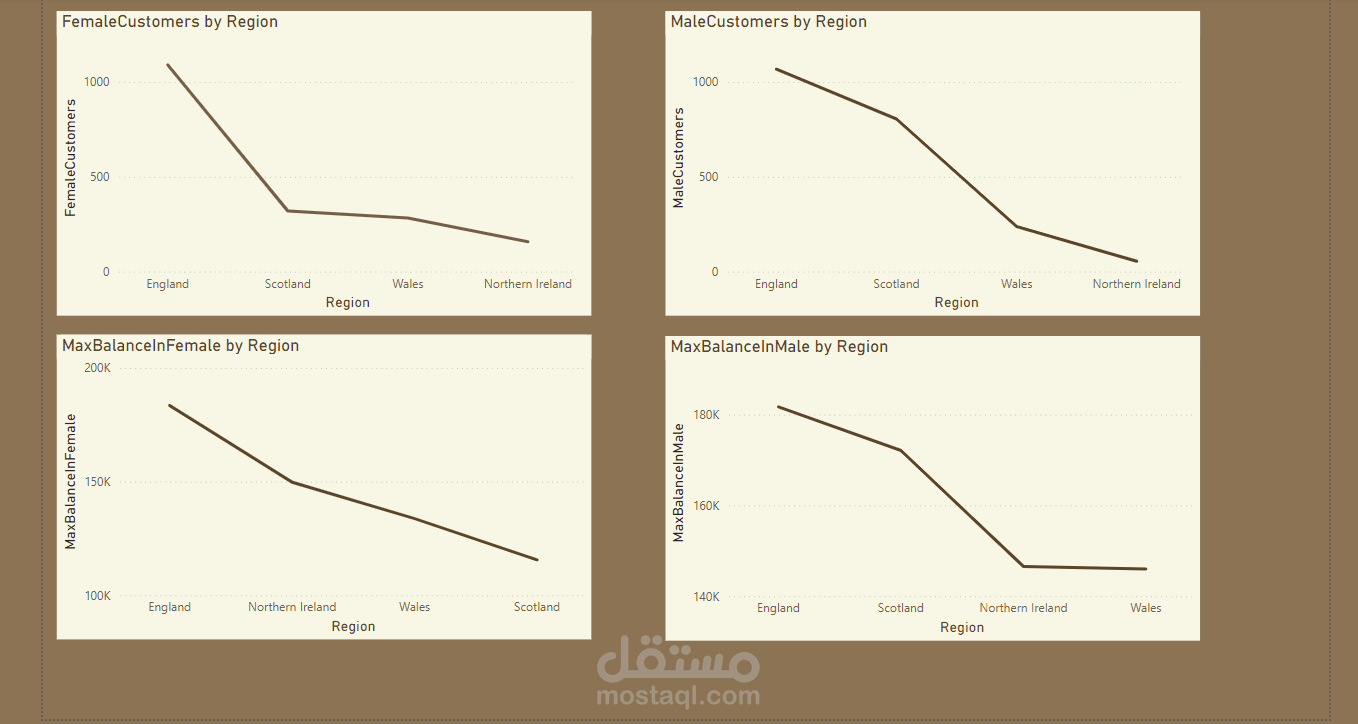
Regional heat map of balances
Detailed demographic table
Insights:
Some regions have higher average balances.
Retired and self-employed customers tend to hold more savings.
Gender differences exist but are not very large.
Certain regions and groups show growth opportunities.
Conclusion:
The dashboard helps the bank understand customer behavior and improve targeting, services, and growth strategies.