Apple’s sales data to understand products, stores, and performance trends.
تفاصيل العمل
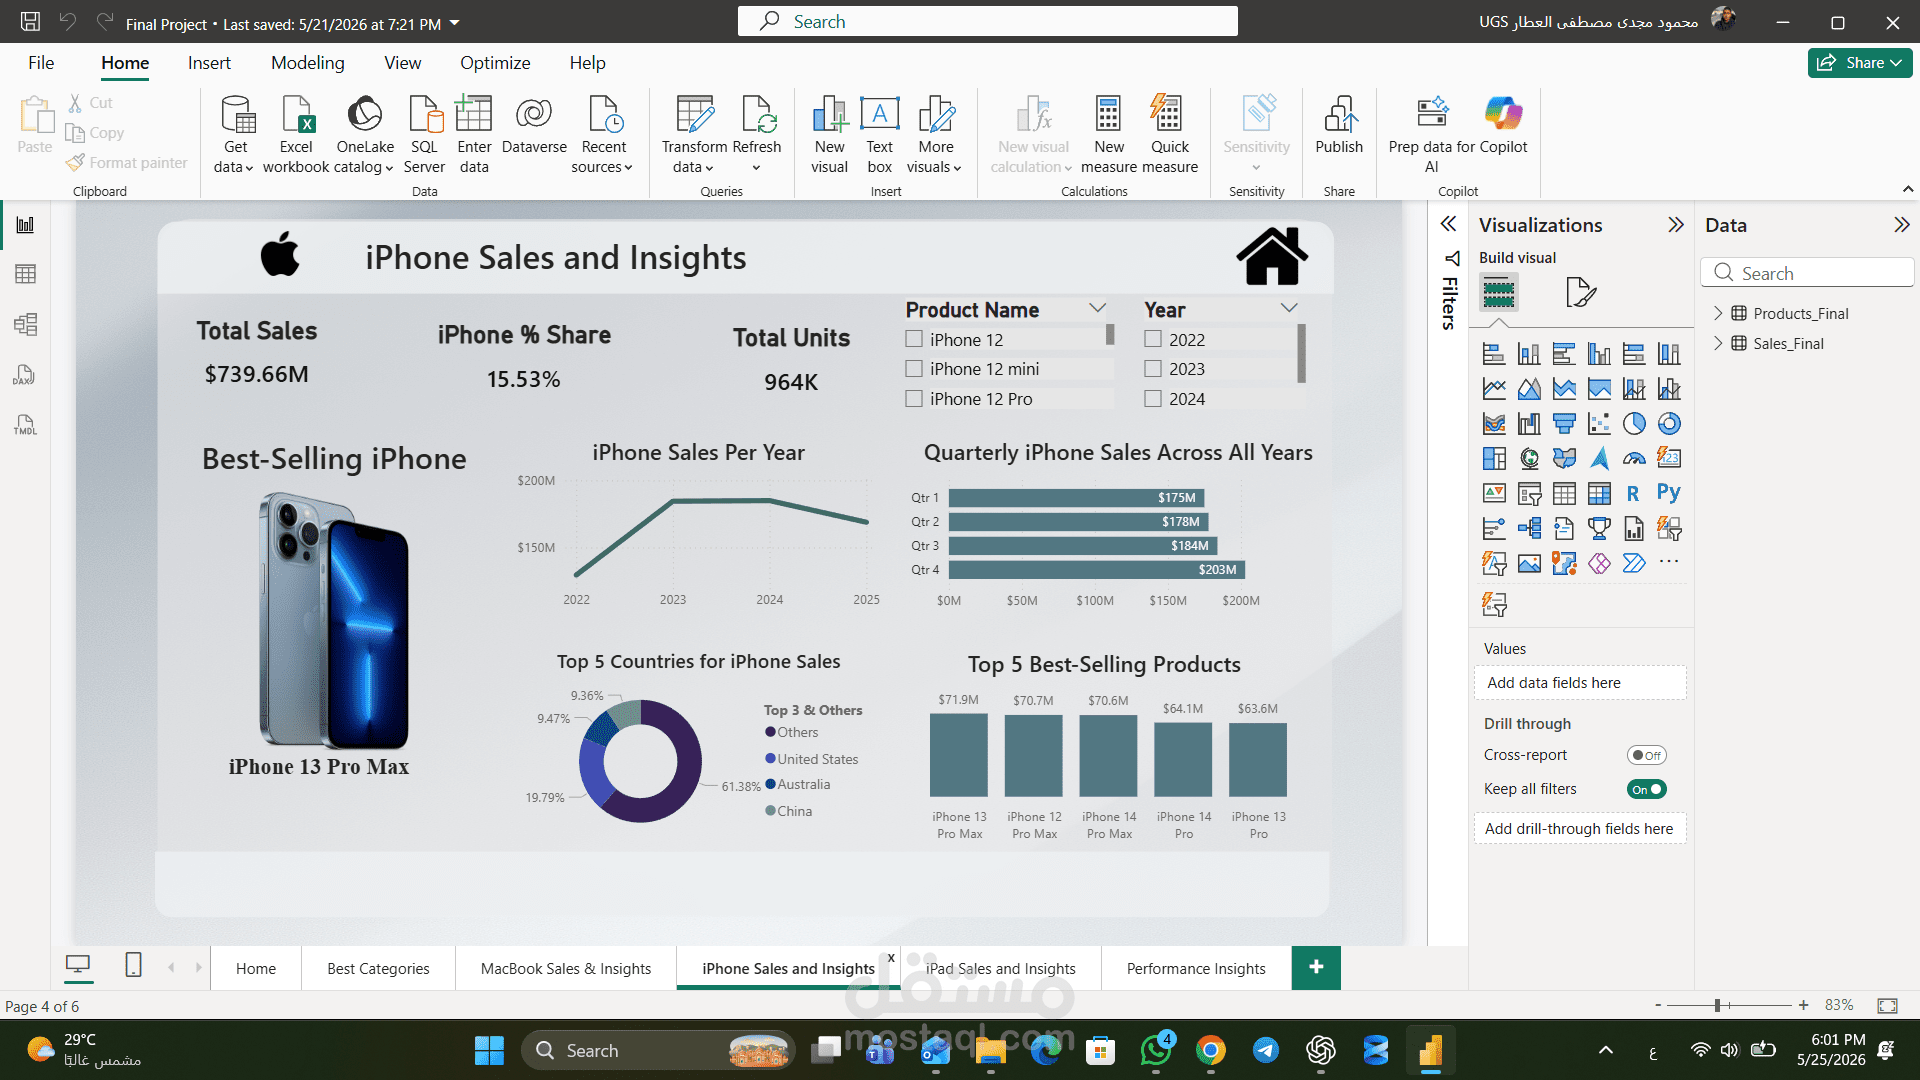
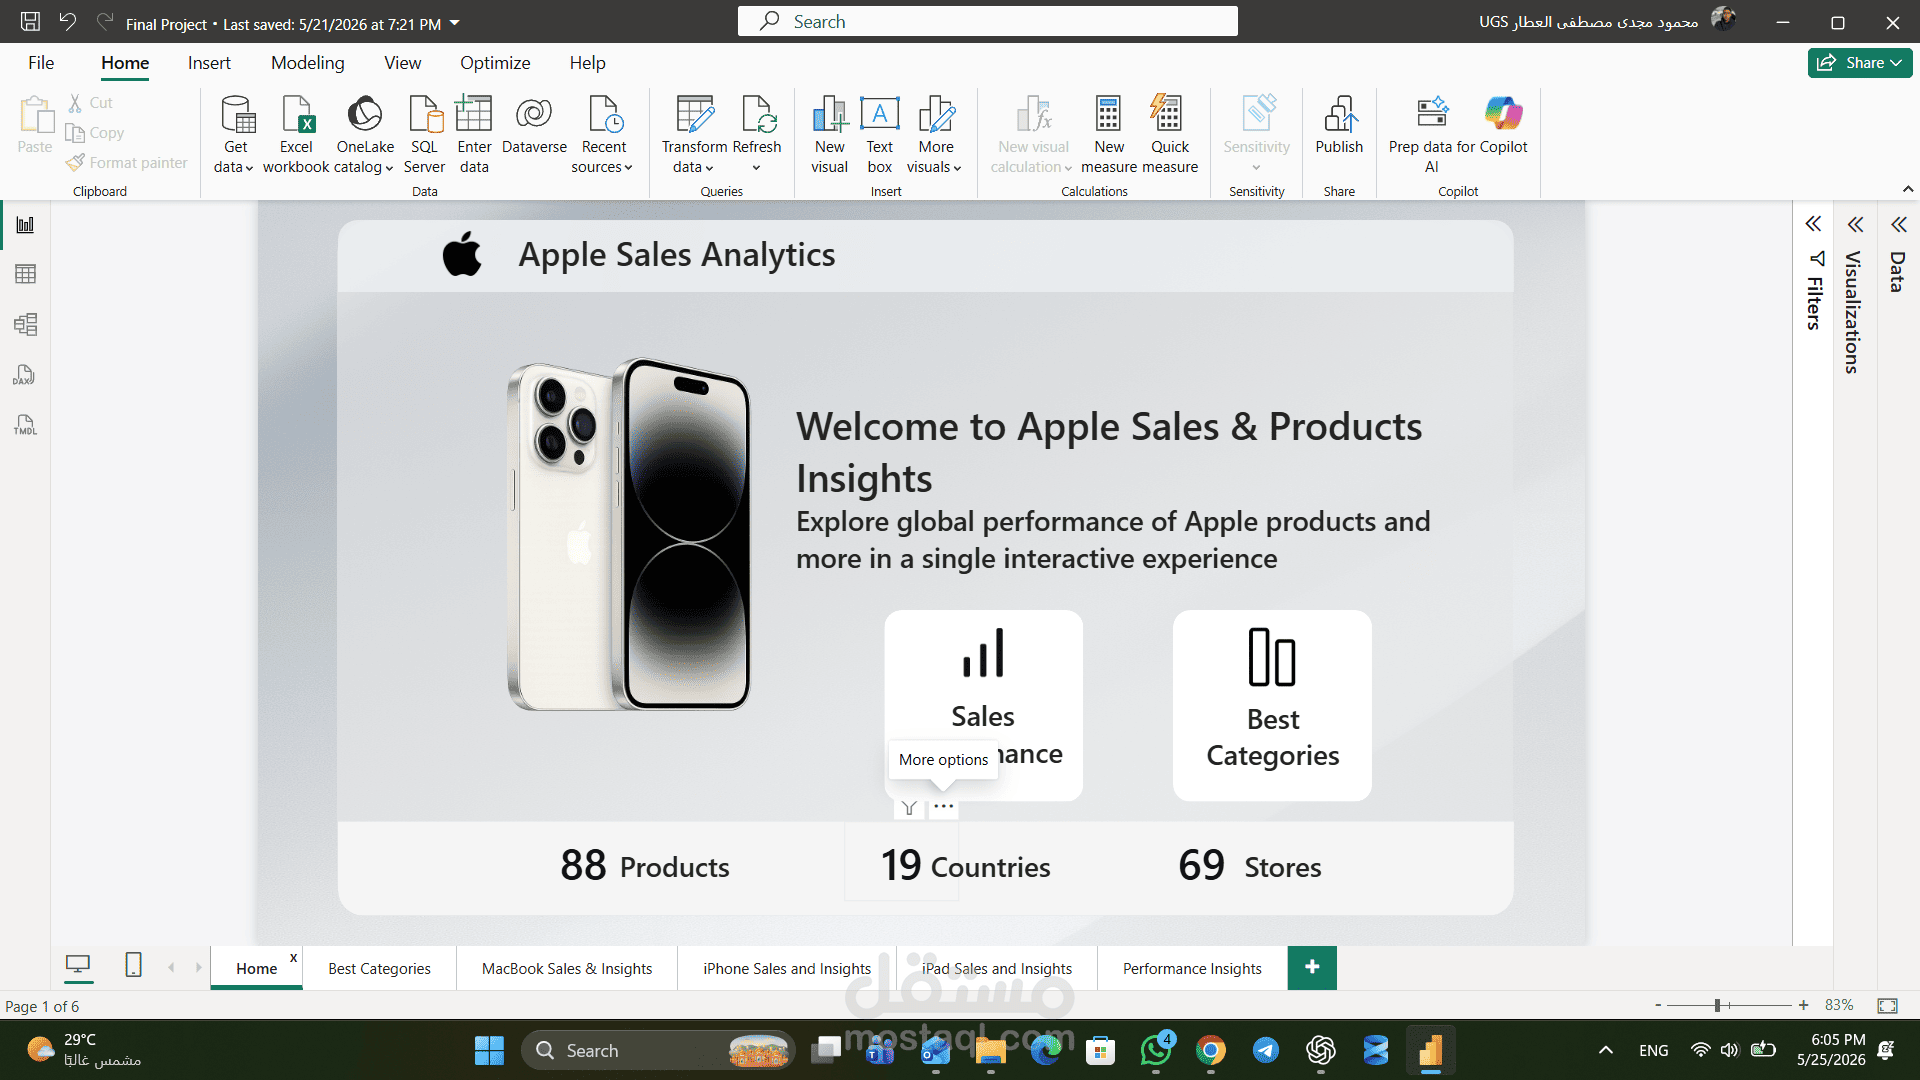
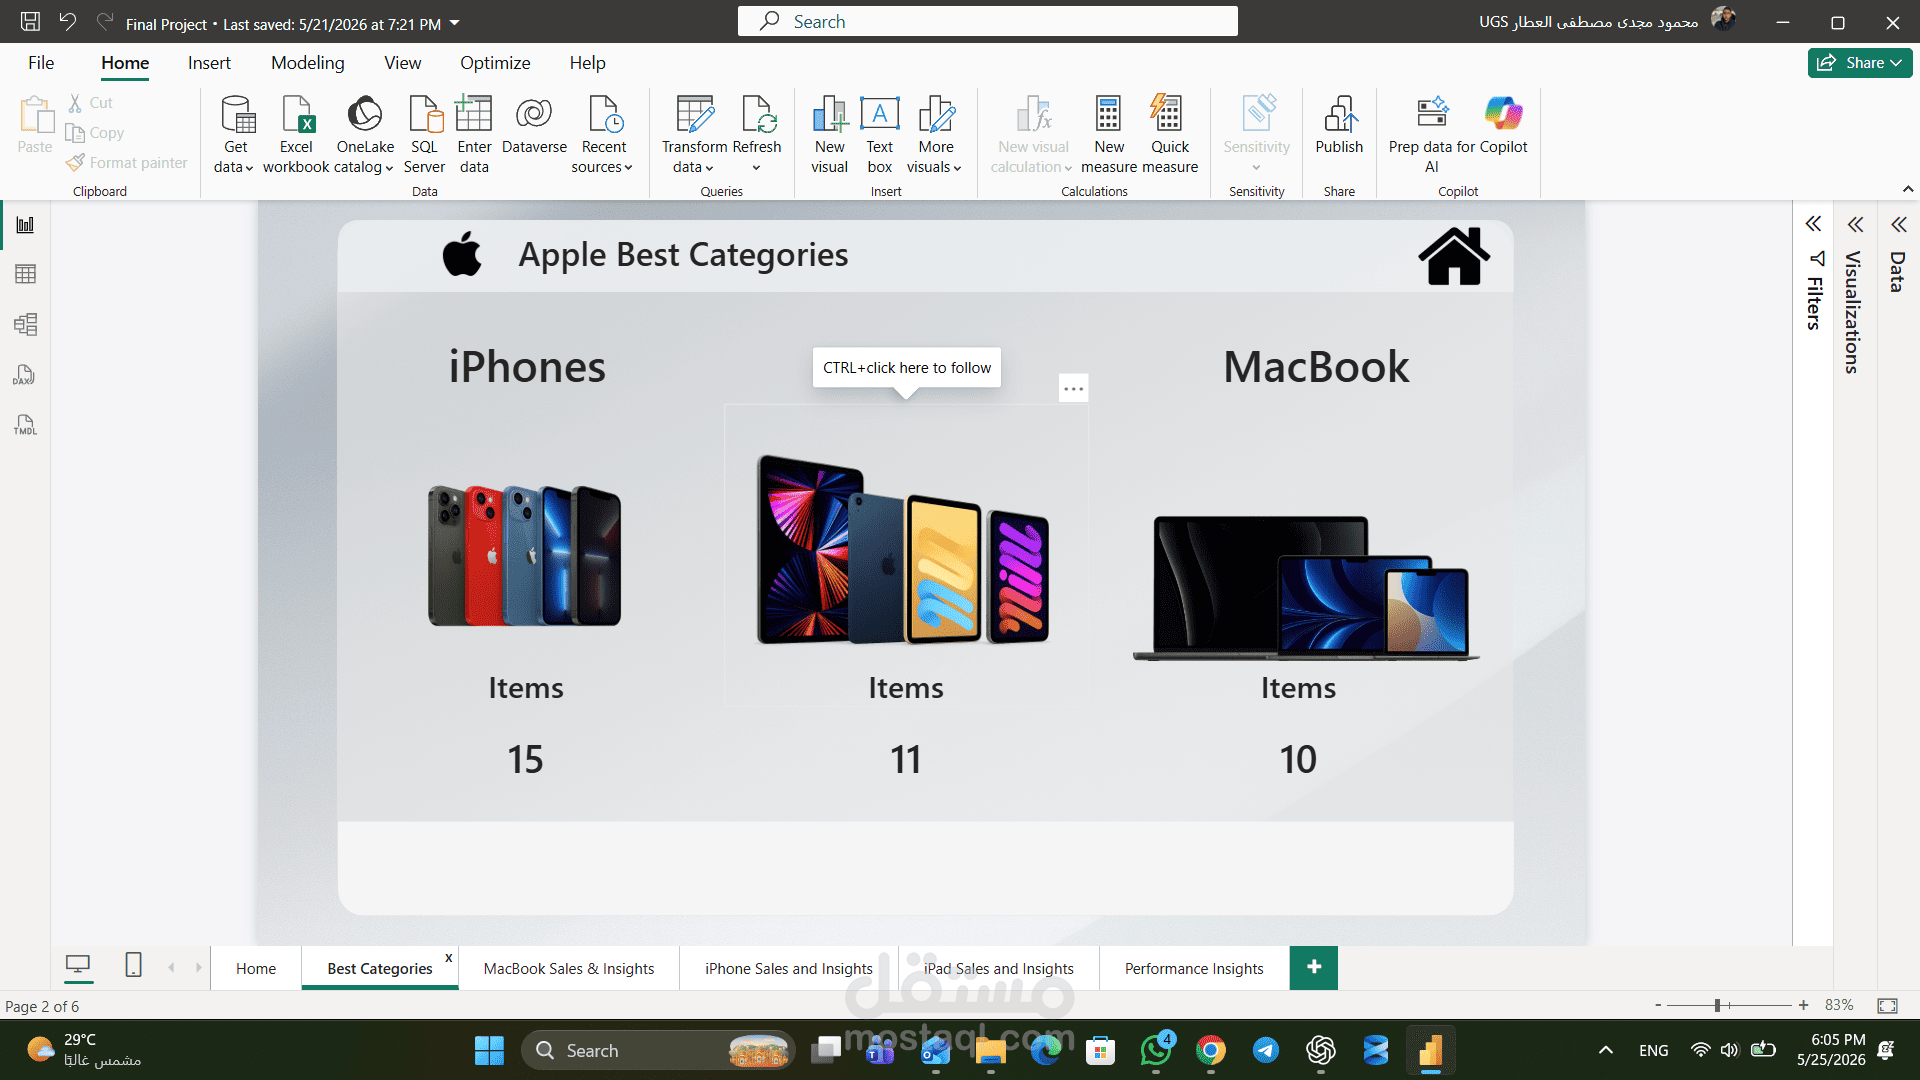
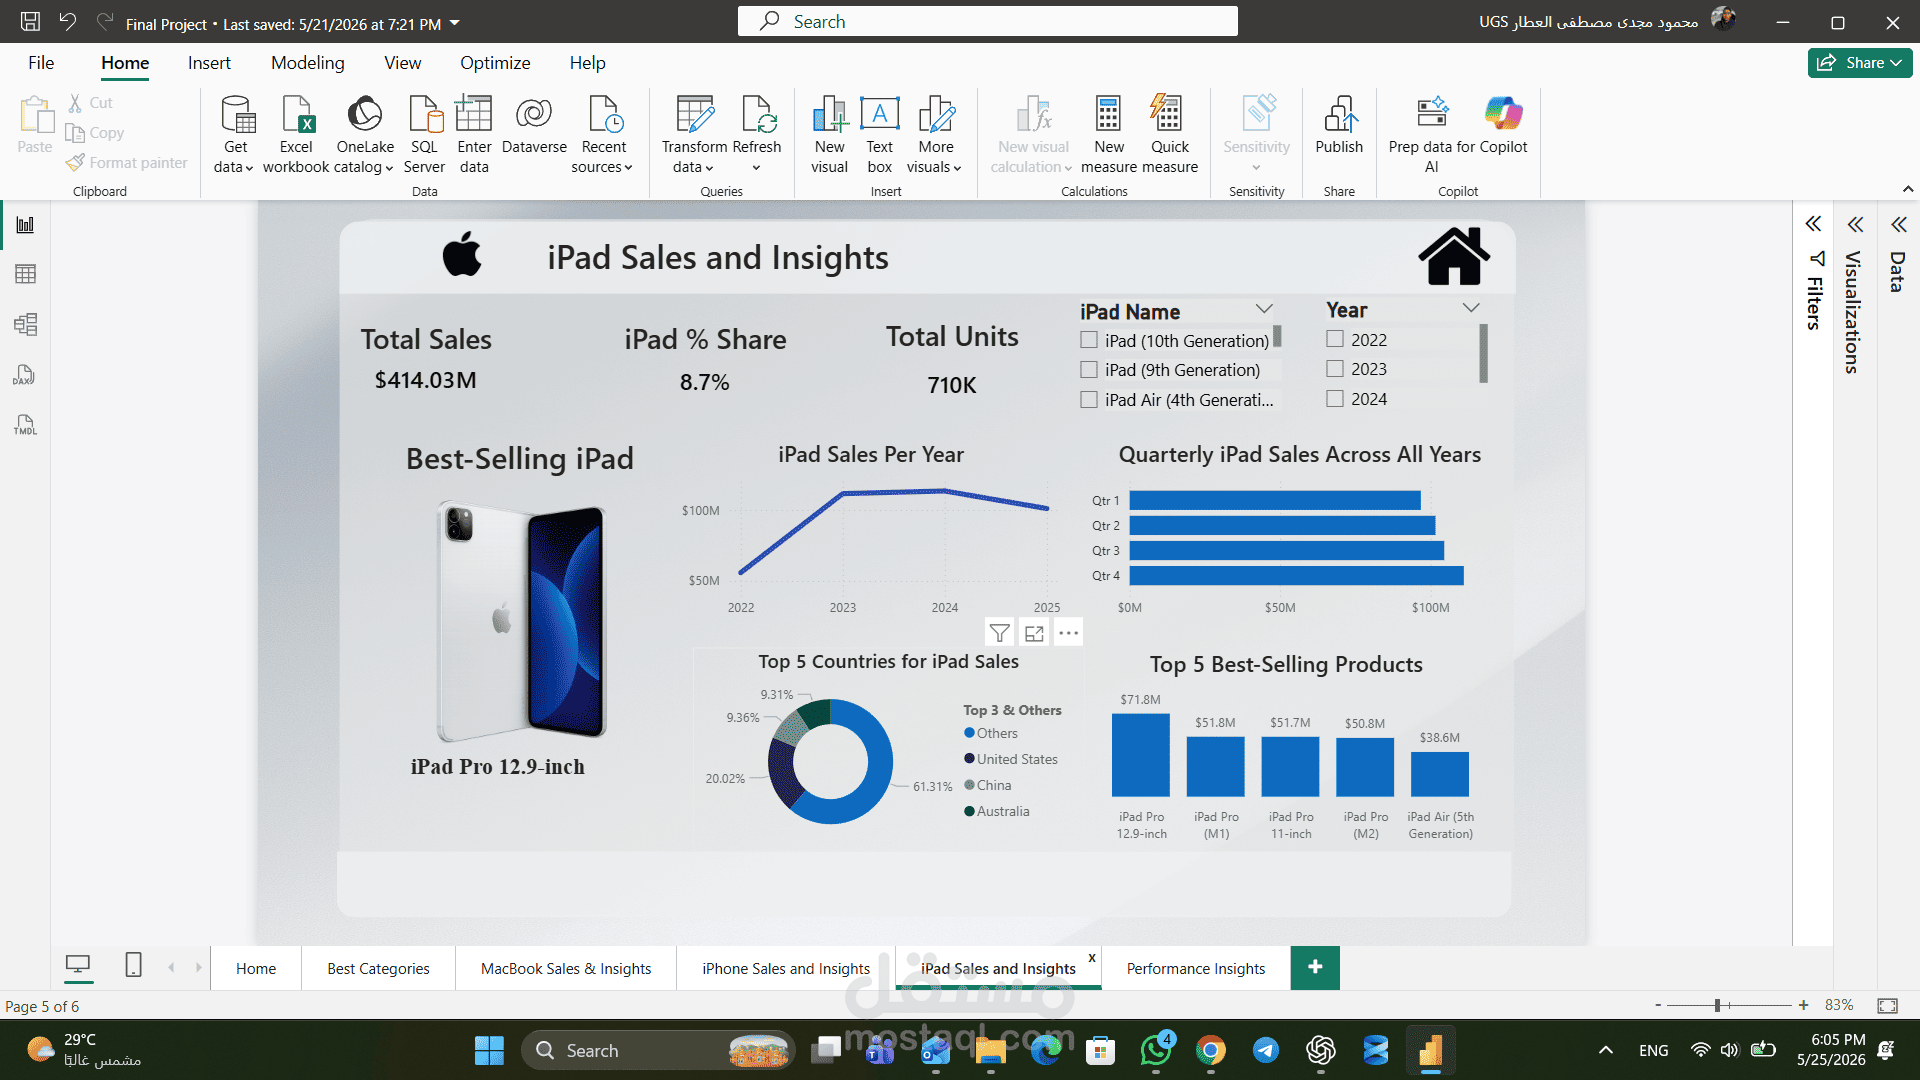
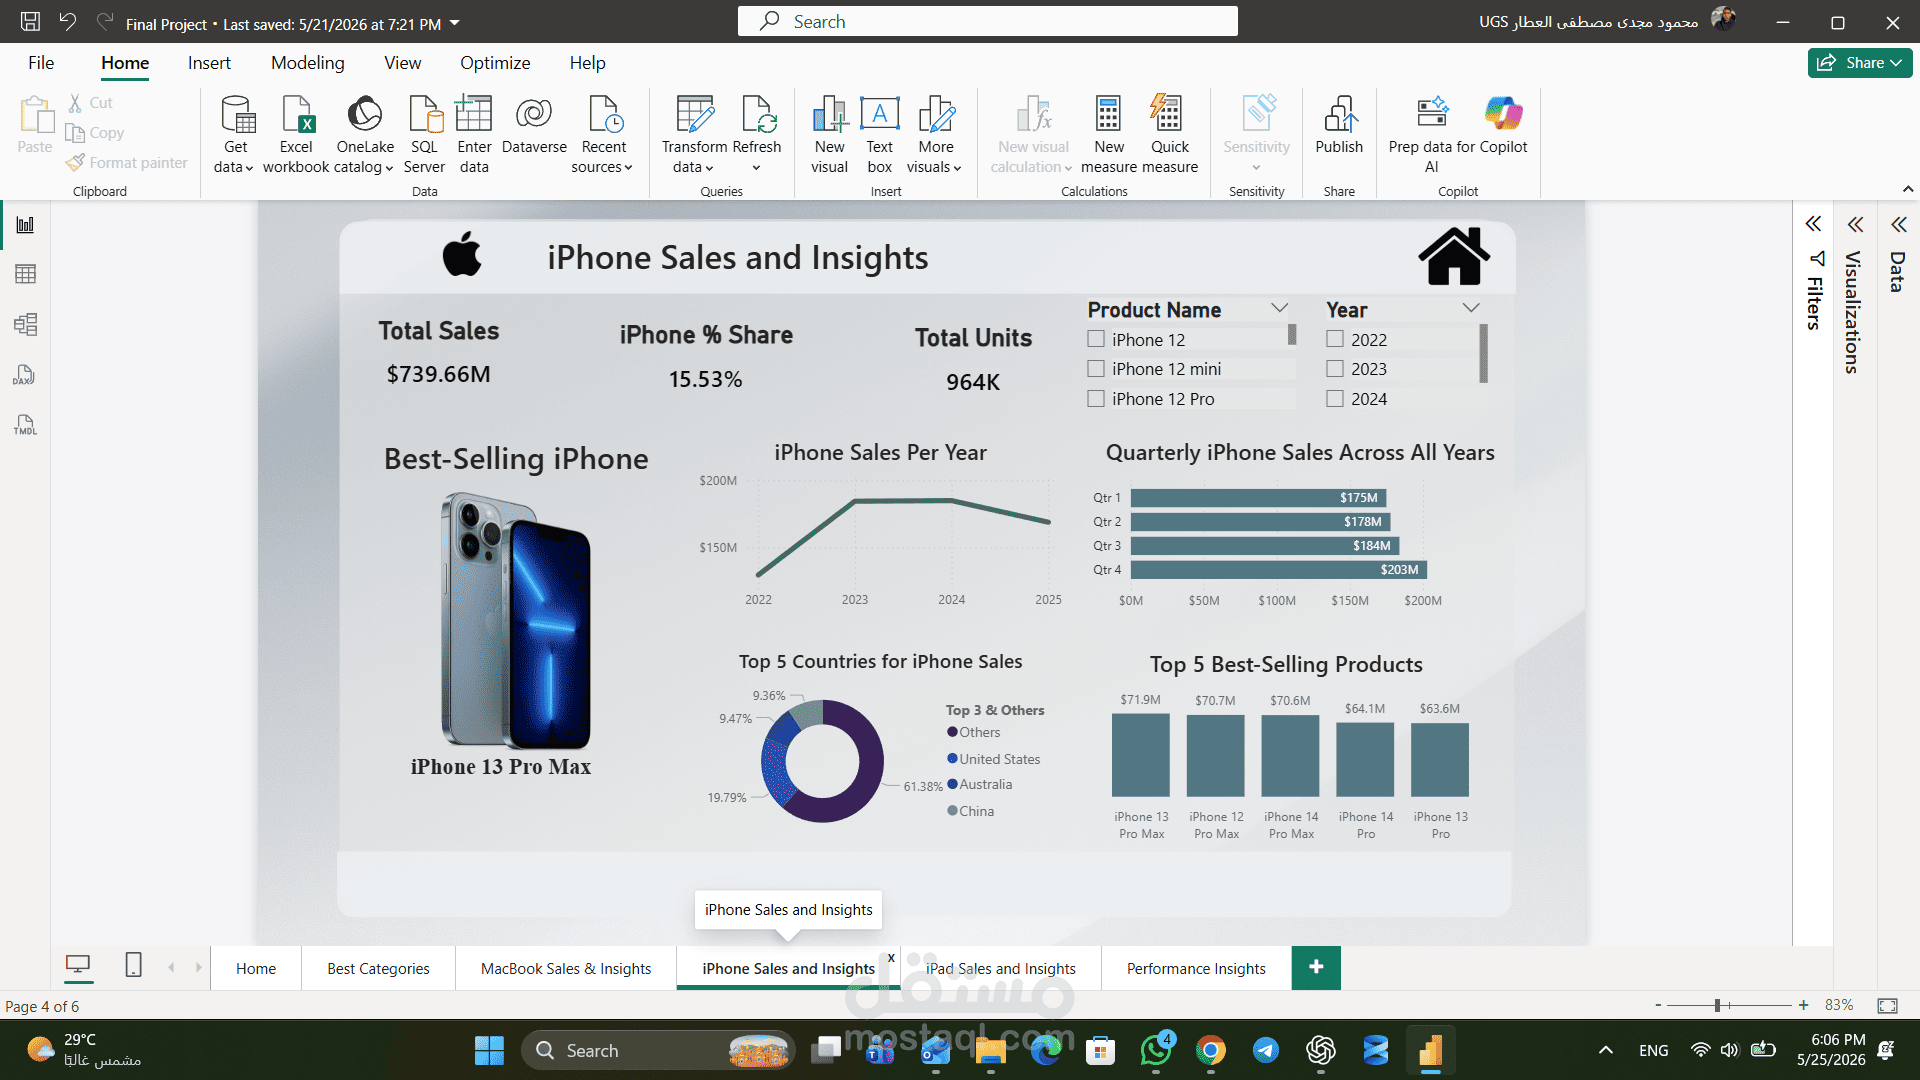
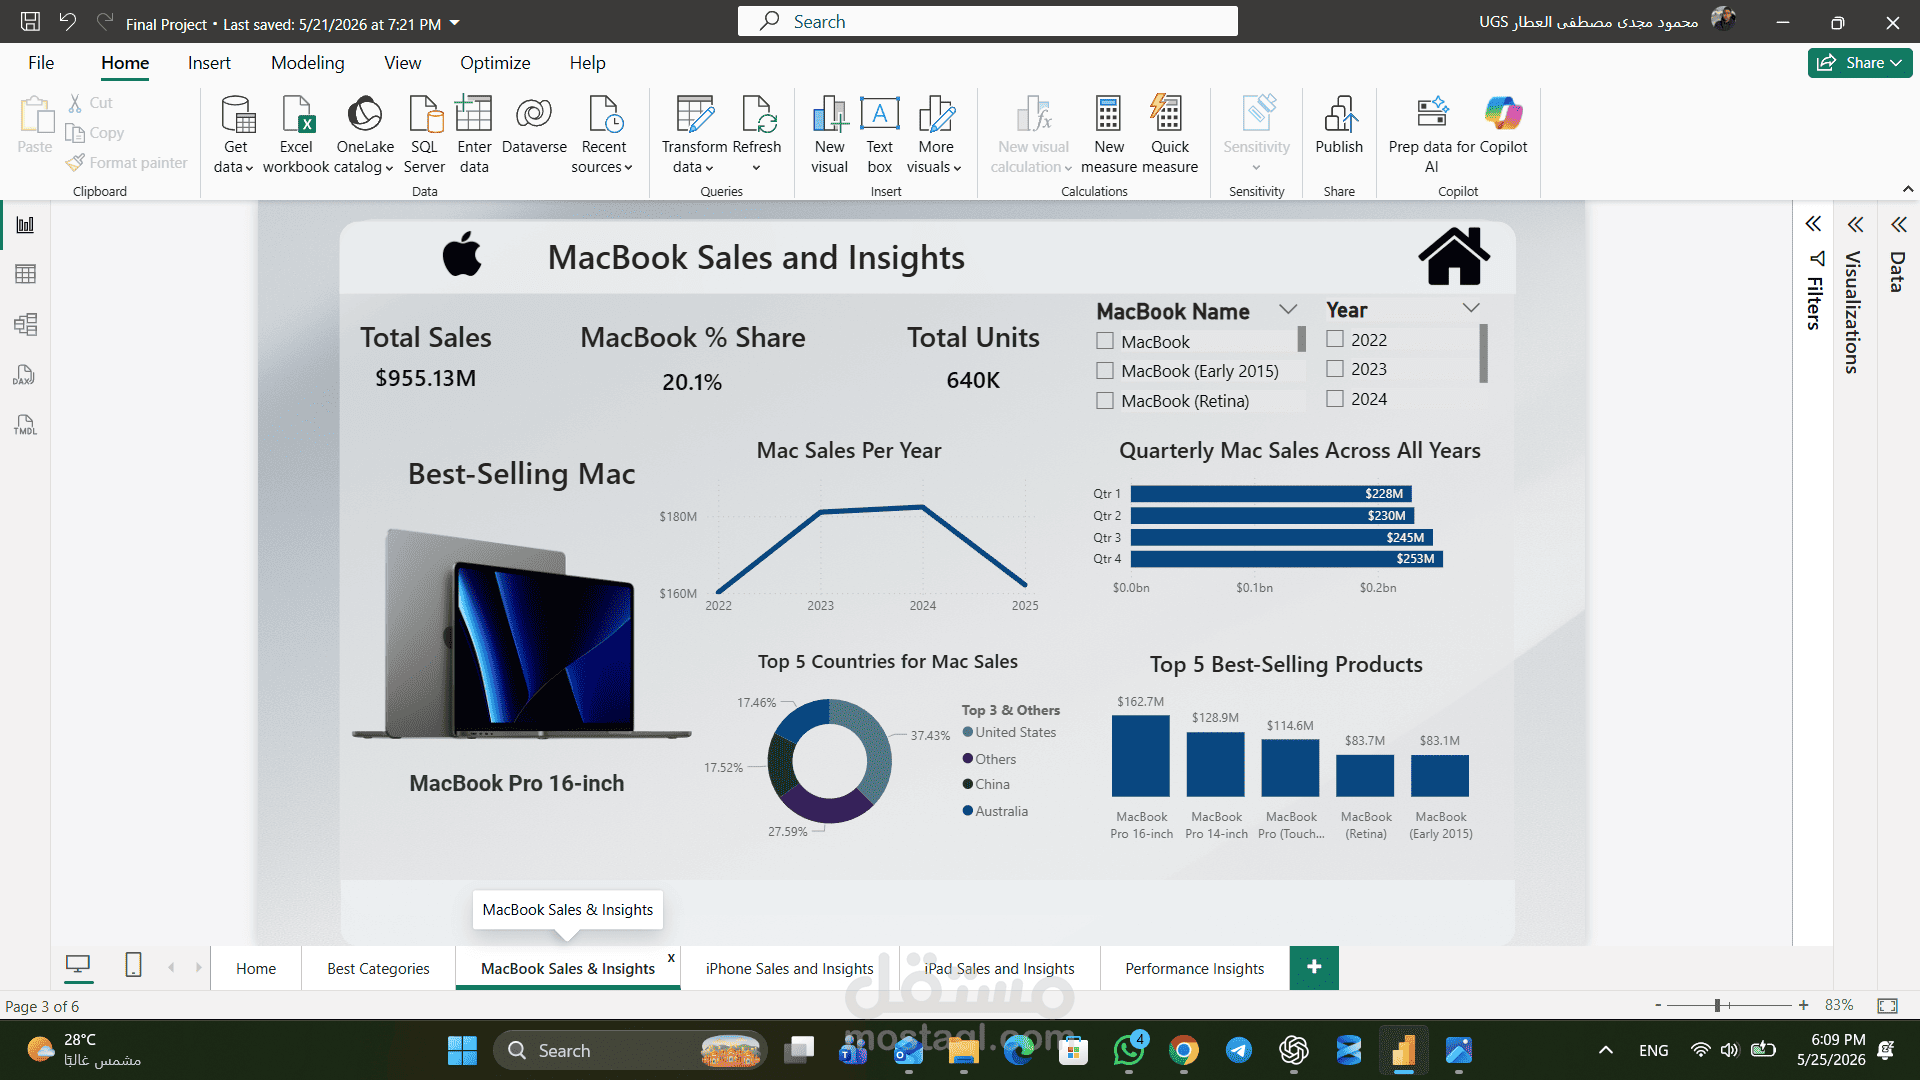
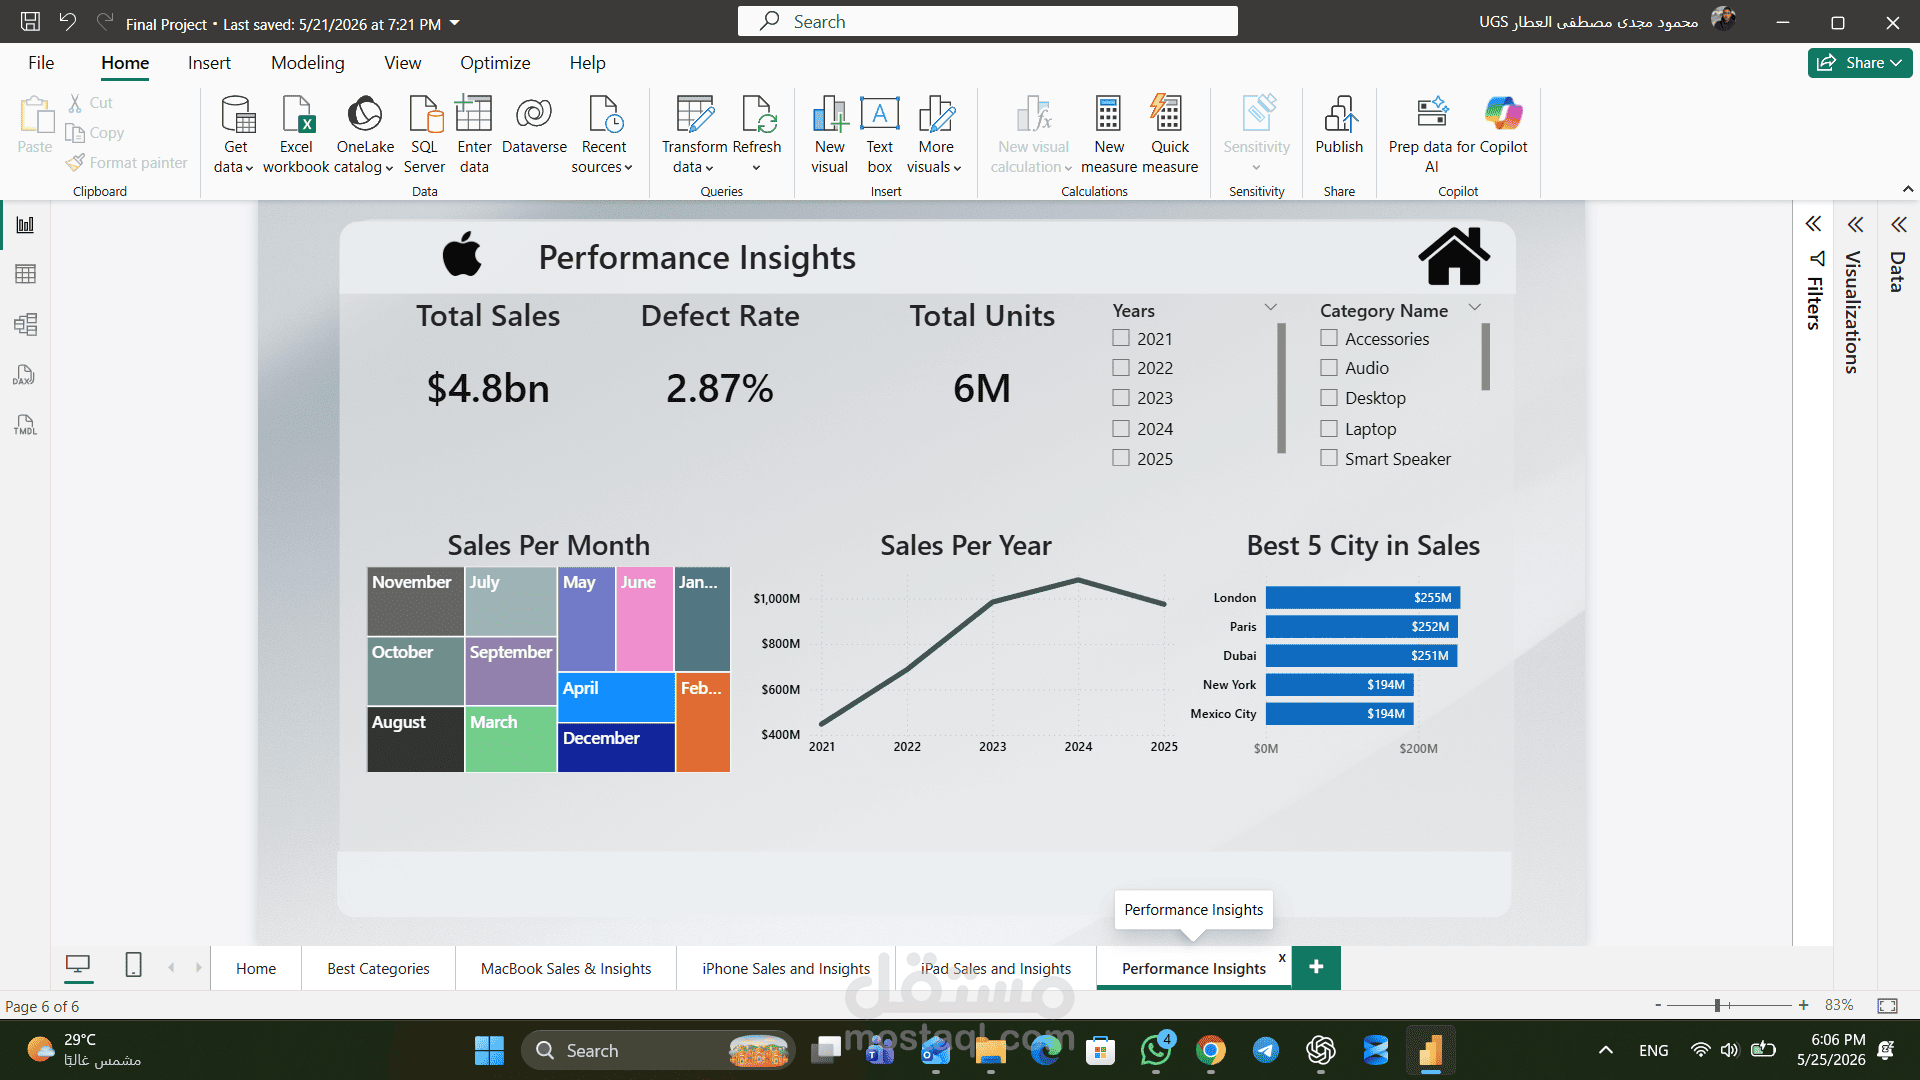
Data Cleaning & Validation (Excel): Checked for missing or inconsistent values, corrected inaccurate product and launch dates, and prepared the data for analysis.
Data Integration & Performance Learning (SQL → Power BI):
We initially integrated datasets using SQL Server, which helped us explore relationships across Sales, Products, Stores, Categories, and Warranty. While this approach revealed some performance limitations for large dashboards, it became a valuable learning experience. We applied a Star Schema design in Power BI, which significantly improved efficiency and analytical flexibility a great example of turning a challenge into a practical solution.
ETL & Transformation (Power Query / Power BI): Standardized product names, handled gaps, and shaped data for analysis.
KPIs (Power BI & DAX): Created measures like Market Share %, Defect Rate, and Total Sales.
Predictive Analytics (Python): Forecasted sales for the upcoming year using time series analysis.