EVALUATION THE PROCESS OF NESPRESSO INVENTORY SYSTEM
تفاصيل العمل
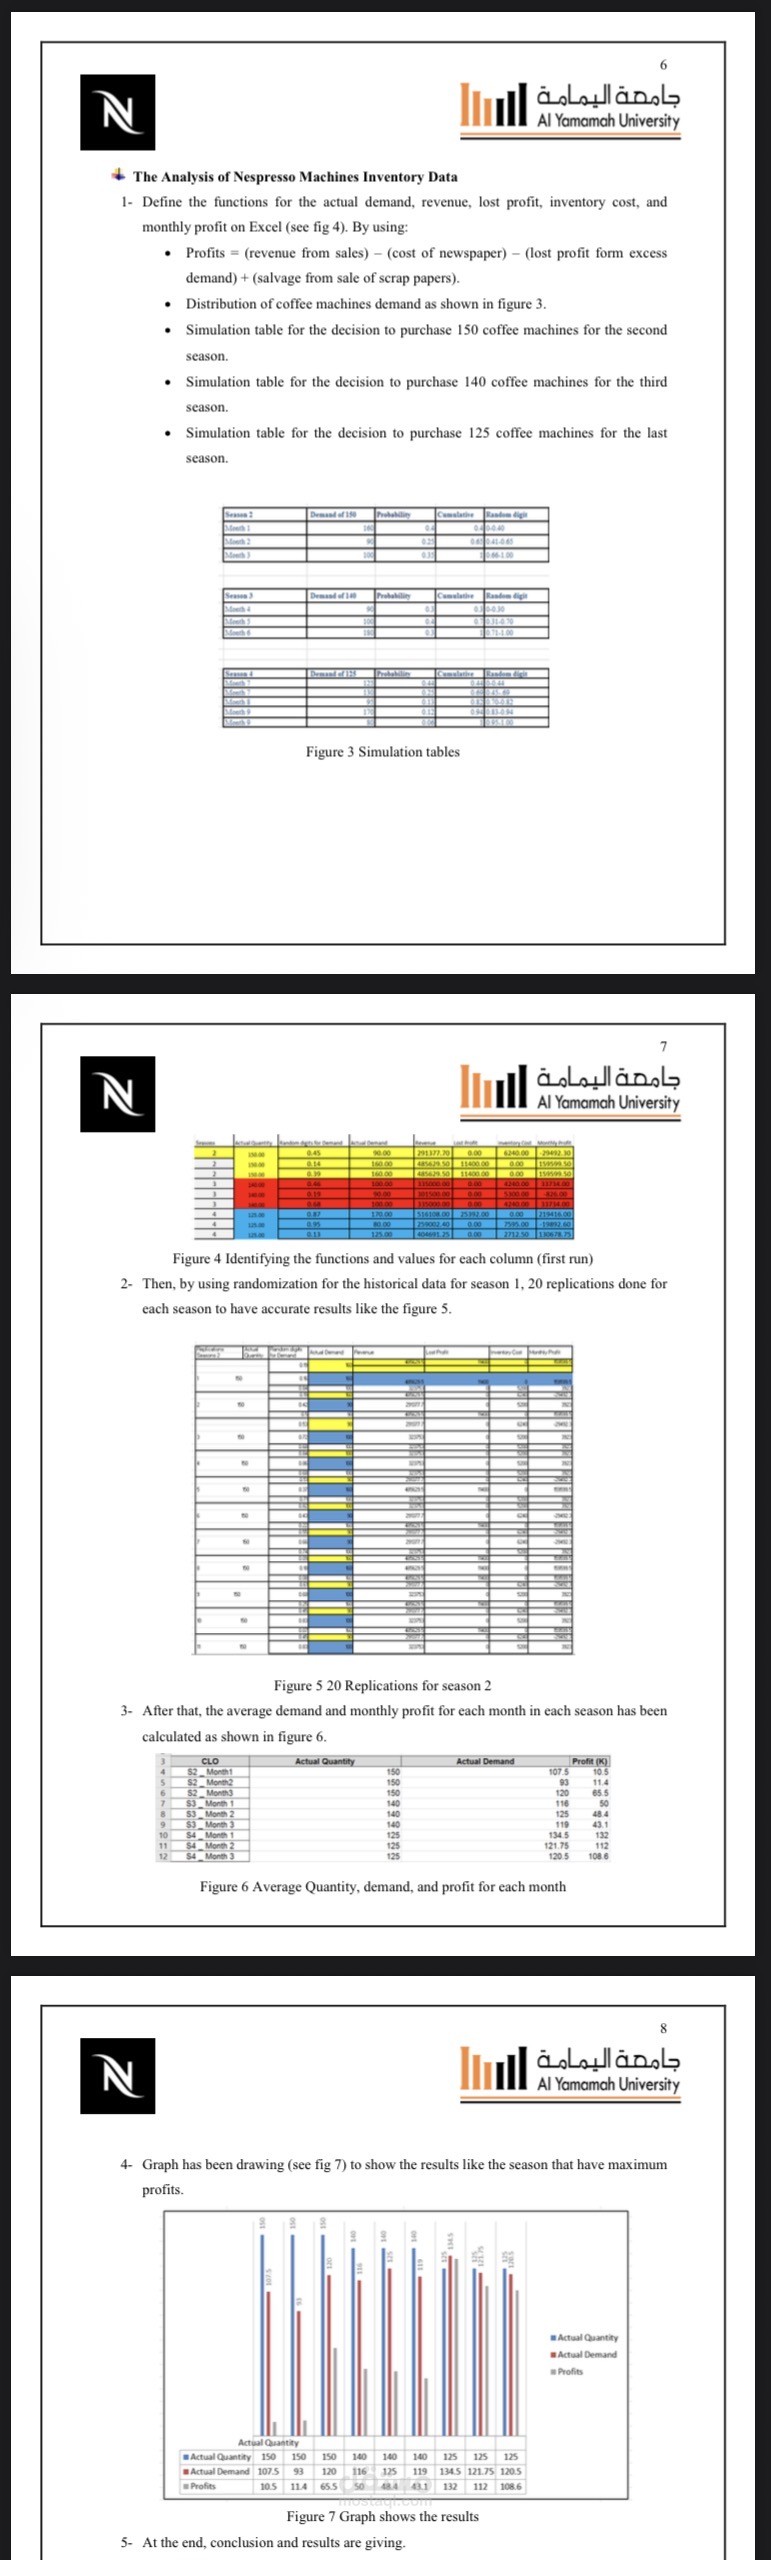
after we analyzed Nespresso's machine data in excel and calculated the revenue
for the last profit, inventory cost, and monthly profit for each month in each season, we found
that season 3 has the maximum profit, while season 2 has the least profit. The actual demand
is close to the actual quantity of the machines in season 4, so that led to having less inventory
cost, which will affect the profit more than having a high inventory cost. In addition, the actual
quantity of all the months was higher than the actual demand in season 3, so that led to having
many machines in the inventory. As a result, despite the high revenue during this season, the
profit was low due to the high cost of inventory. Also, the profit for month 3 is higher than for
months 1 and 2 in season 2 because the actual demand for month 3 is slightly closer to the
actual quantity. In this case, months 1 and 2 of this season have the least profit. Ultimately, we
understood that having good forecasting for machine quantity would lead to having a high
9
profit. Our suggestion for the company is to re-review the actual quantity for seasons 2 and 3
in order to have less inventory cost
7. Literature Review
For the multi-objective inventory optimization issue, we suggest a simulation-based
solution methodology. The purpose is to discover optimal reorder point and order quantity
settings in order to minimize three objective functions at the same time: total inventory
cost, average inventory level, and frequency of inventory shortage. We create novel
algorithms that take use of statistically valid ranking and selection (R&S) methods as well
as the appealing mechanics of multi-objective optimization approaches. Two simulation
approaches are presented to be used in various circumstances based on preference
information disclosed either during or after the optimization process. The efficiency of the
created algorithms and other existing solution frameworks is evaluated using experimental
findings [2].