Glow beauty studio
تفاصيل العمل

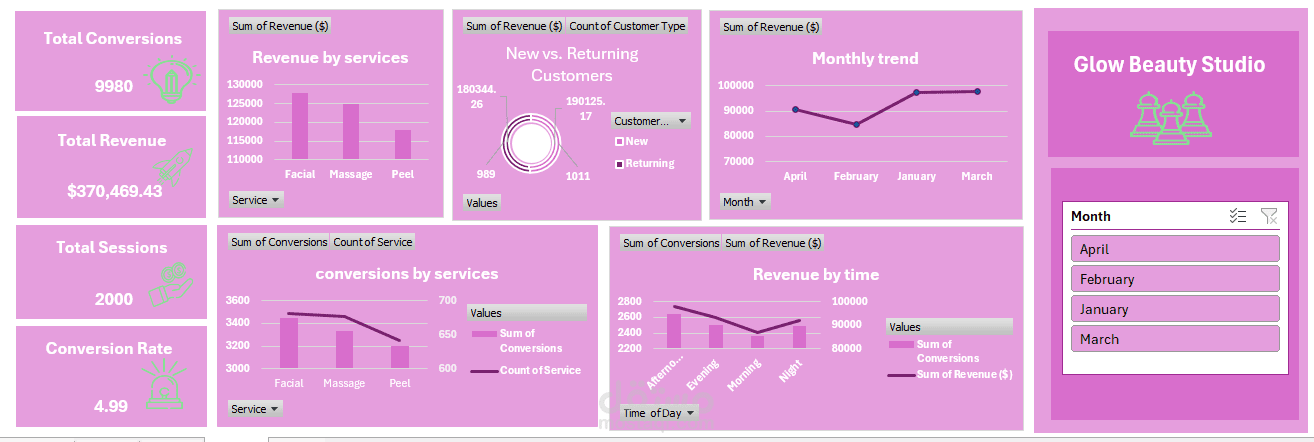
Key Highlights:
$370K+ Total Revenue
9,980 Total Conversions
4.99 Conversion Rate
Revenue analysis by service
New vs Returning customer insights
Monthly trends & revenue by time of day
This dashboard demonstrates how Excel can be used as a powerful data analysis and visualization tool to support data-driven decisions.