E-commerce Data Analysis Project using Python (Pandas) with Interactive Insights & Dashboard
تفاصيل العمل
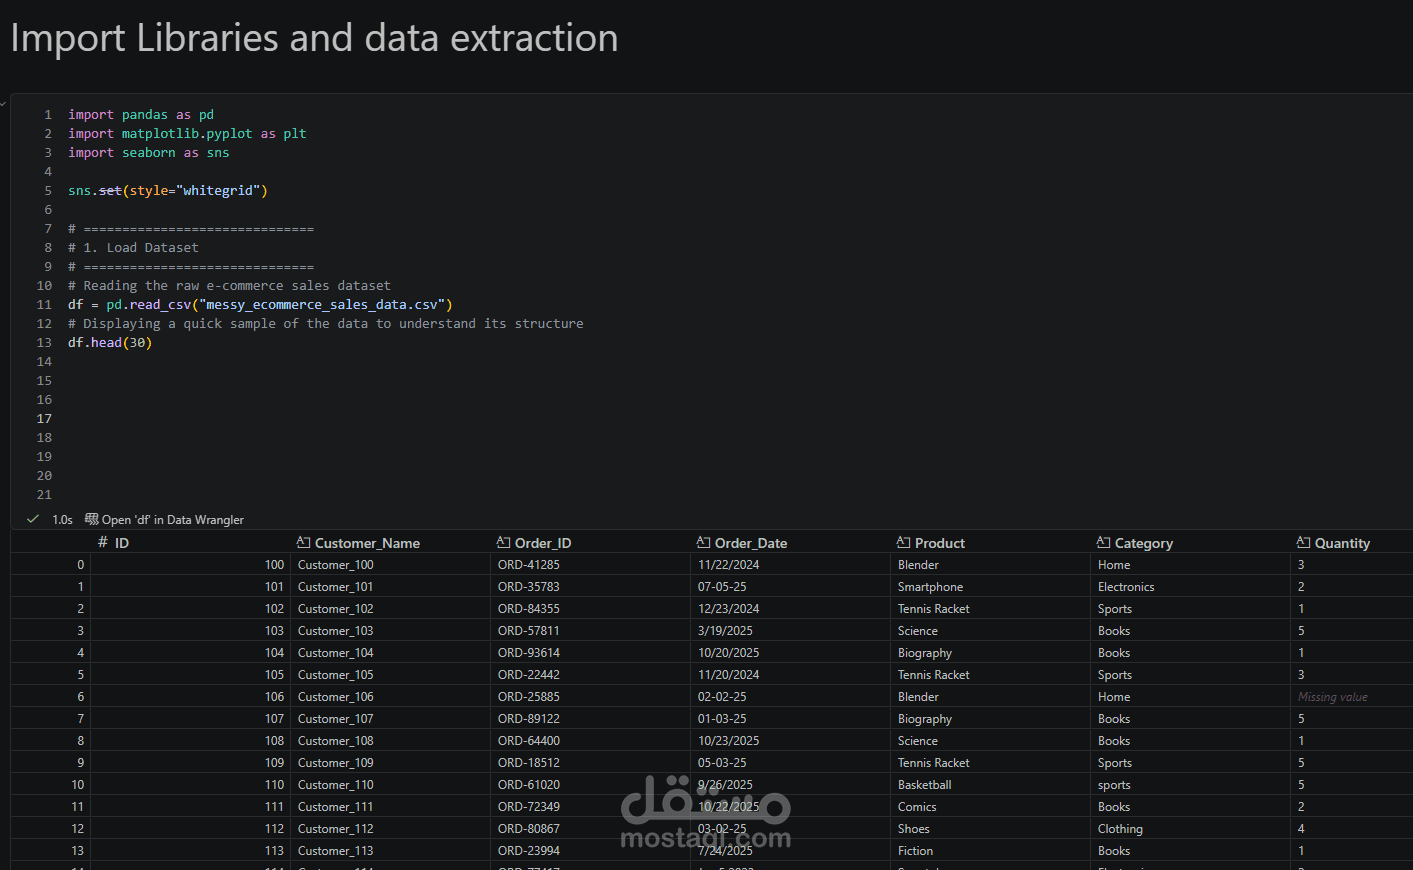
This project is an end-to-end Data Analysis solution built using Python and Pandas on a real-world e-commerce dataset.
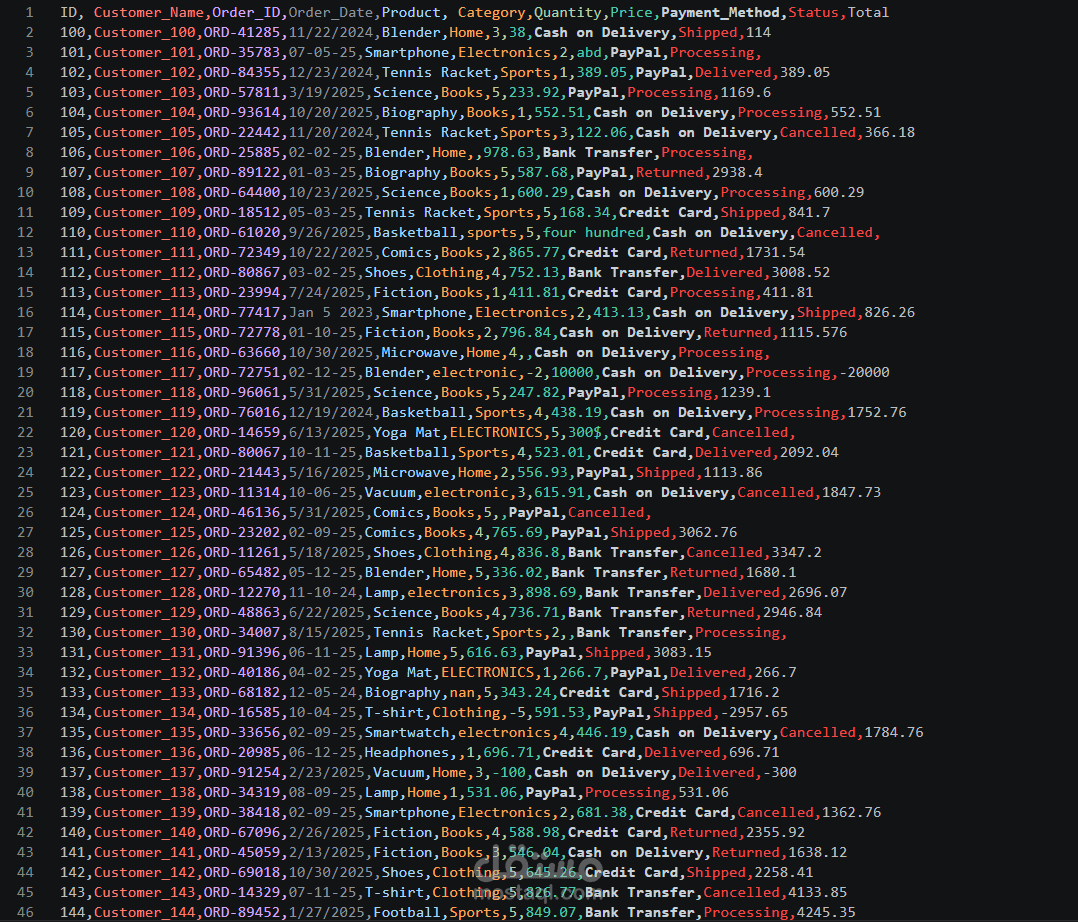
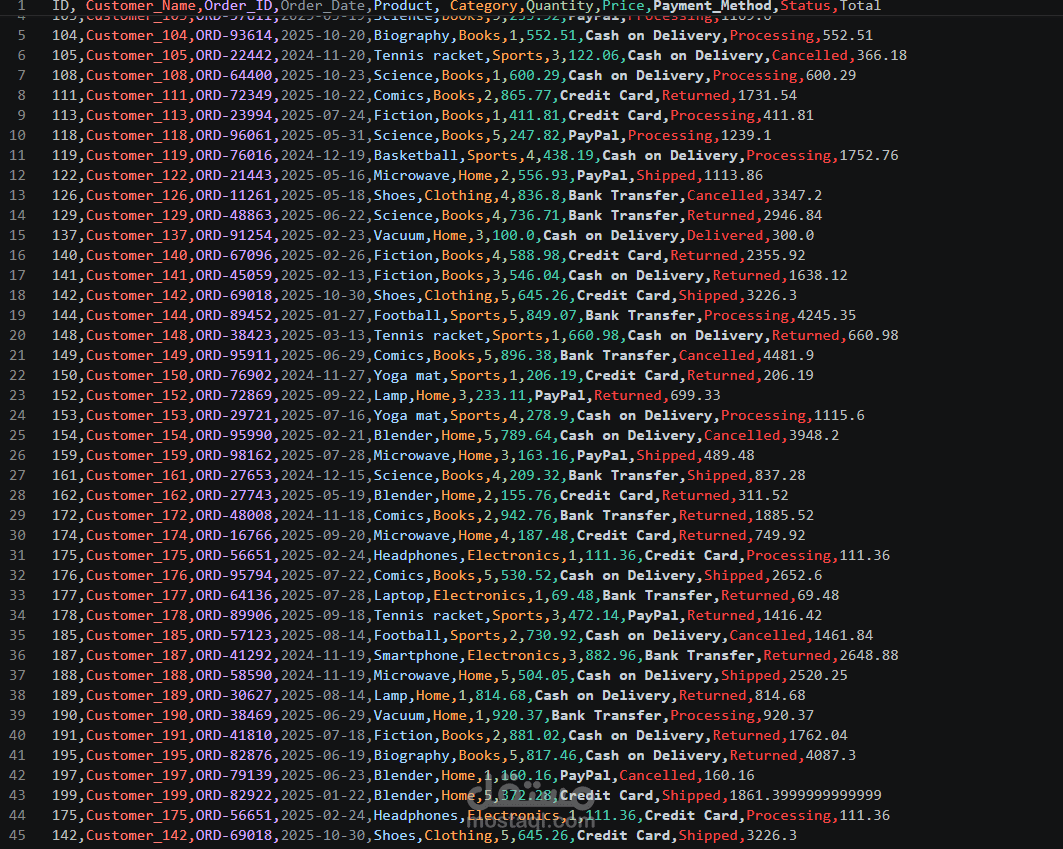
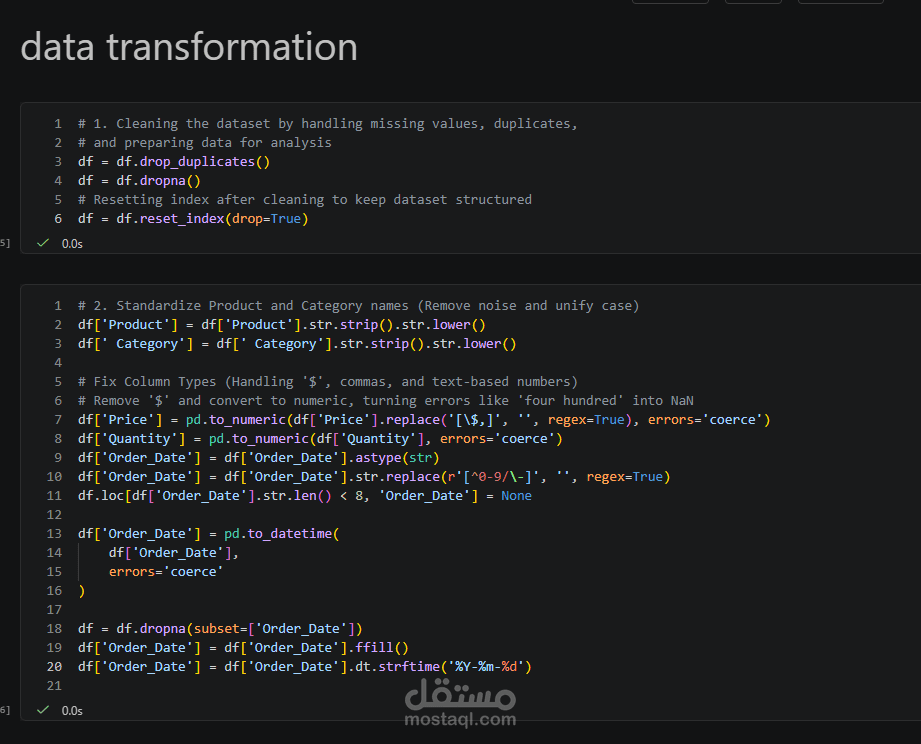
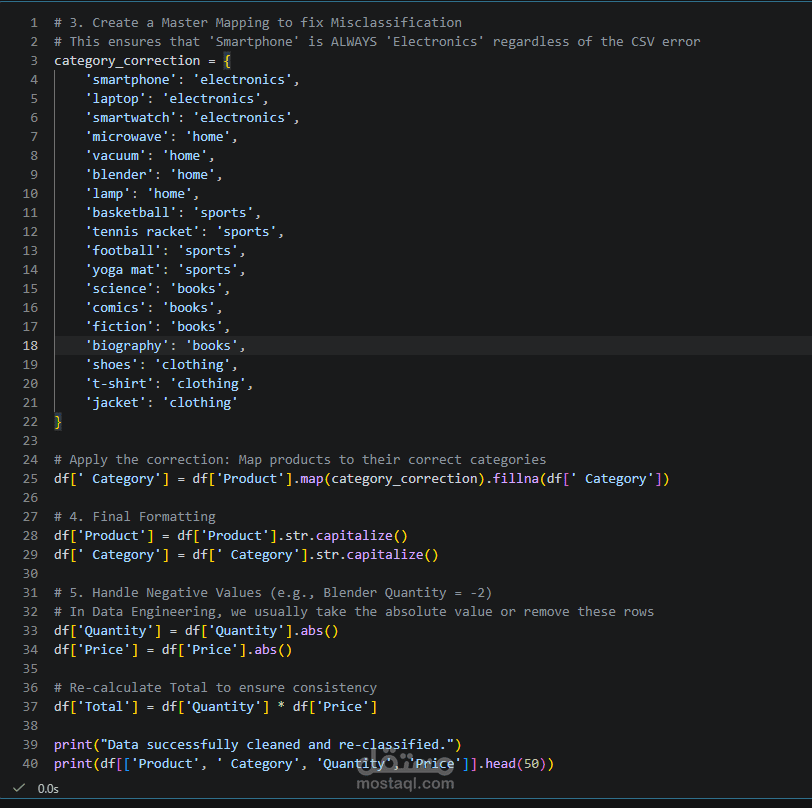
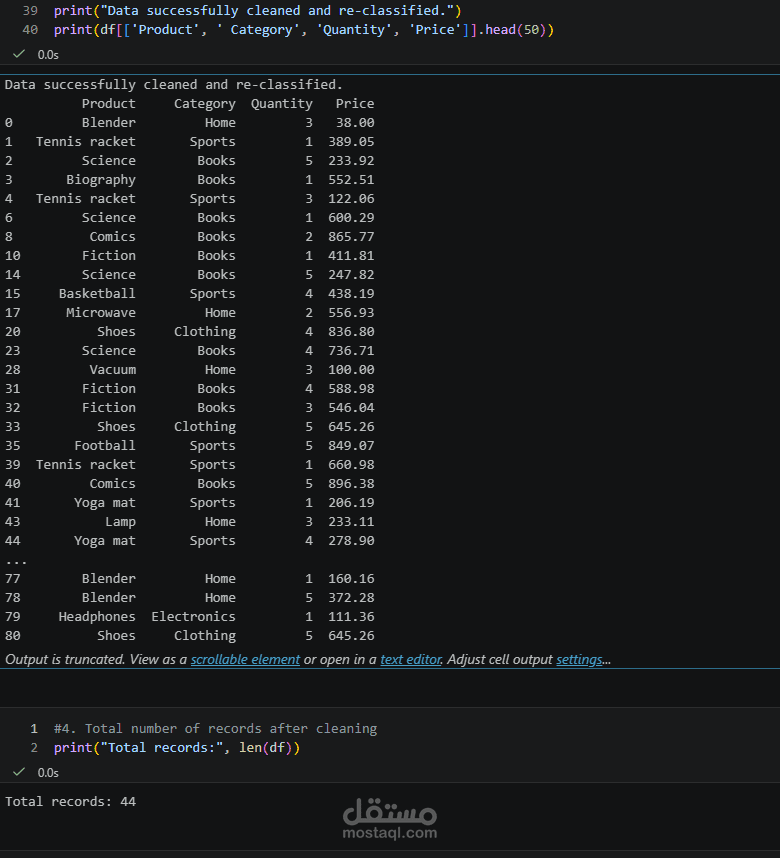
The dataset contained messy and inconsistent data, which was cleaned and standardized as part of the data preprocessing stage. This included handling missing values, fixing date formats, and removing duplicates.
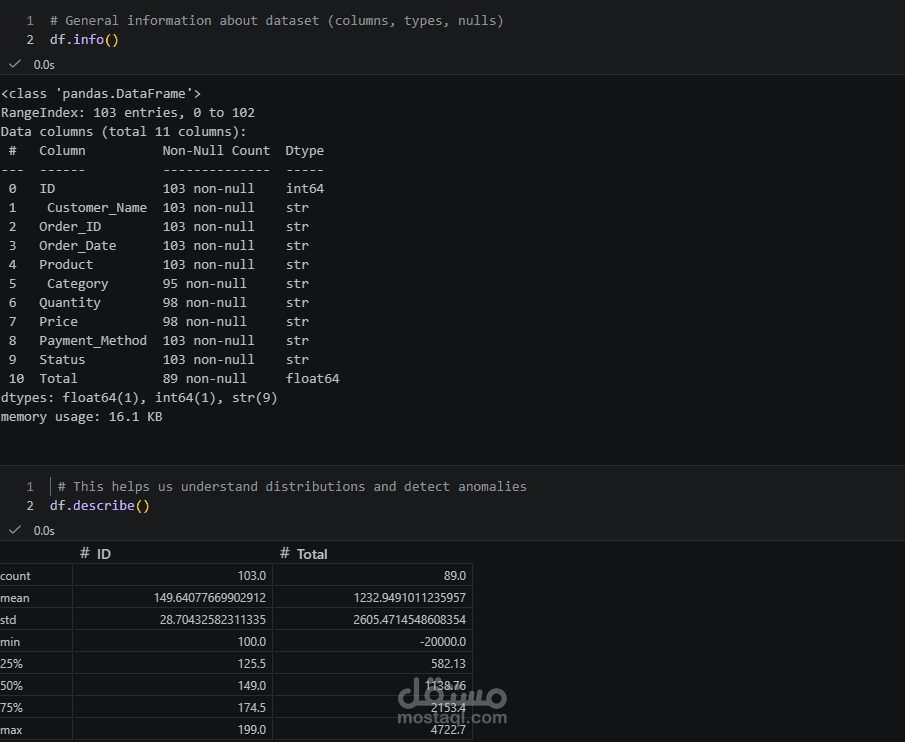
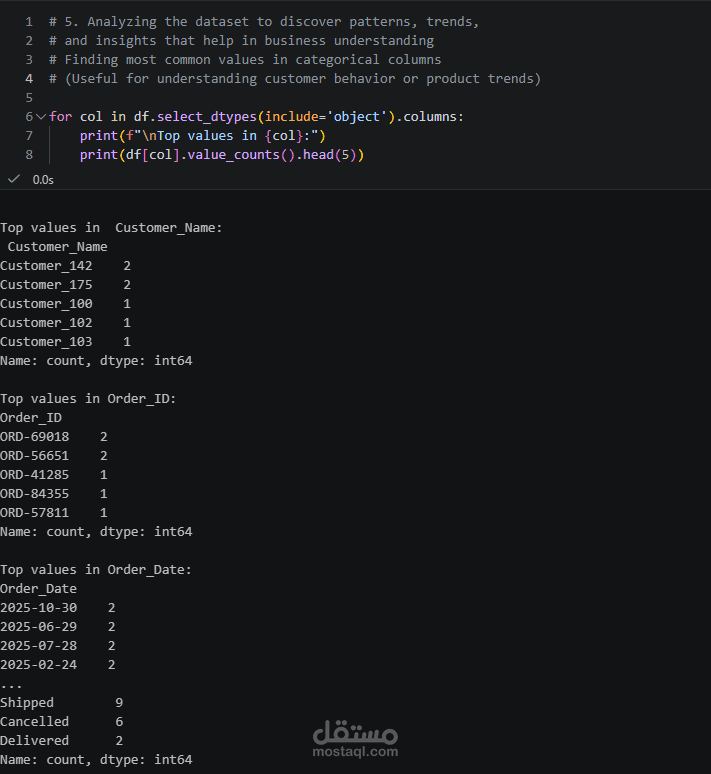
After cleaning the data, exploratory data analysis (EDA) was performed to extract meaningful business insights such as:
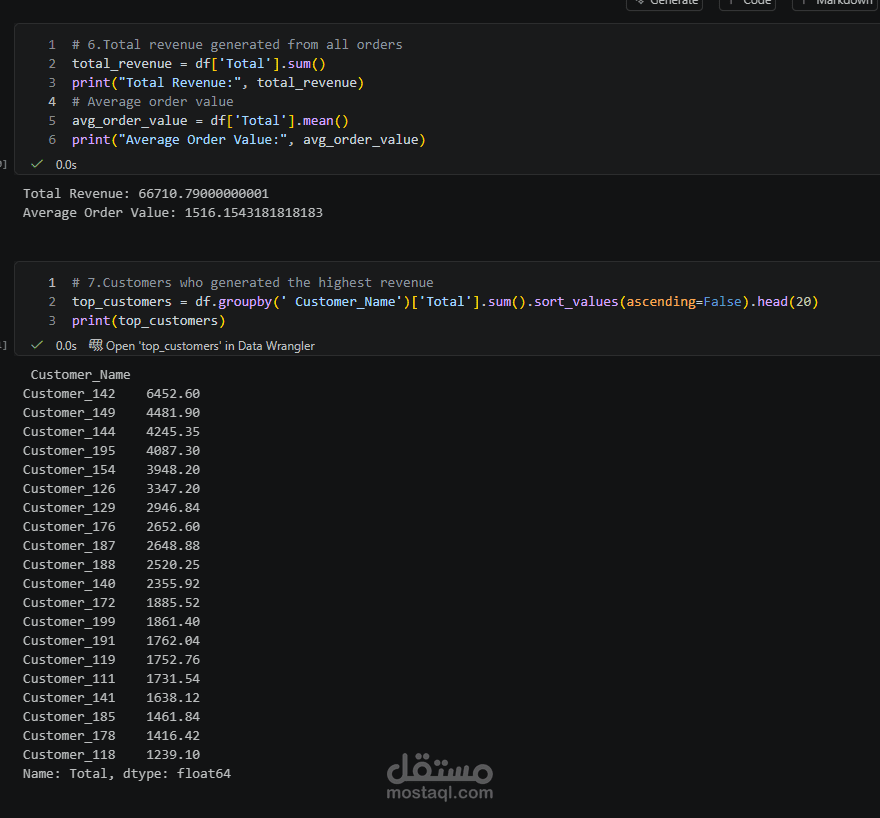
Total revenue and average order value
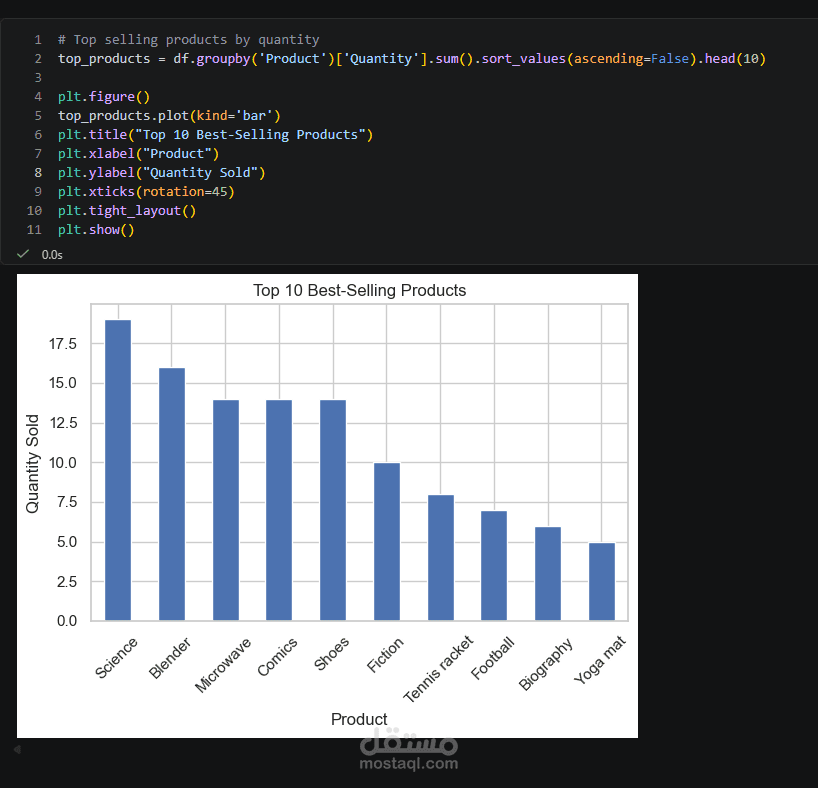
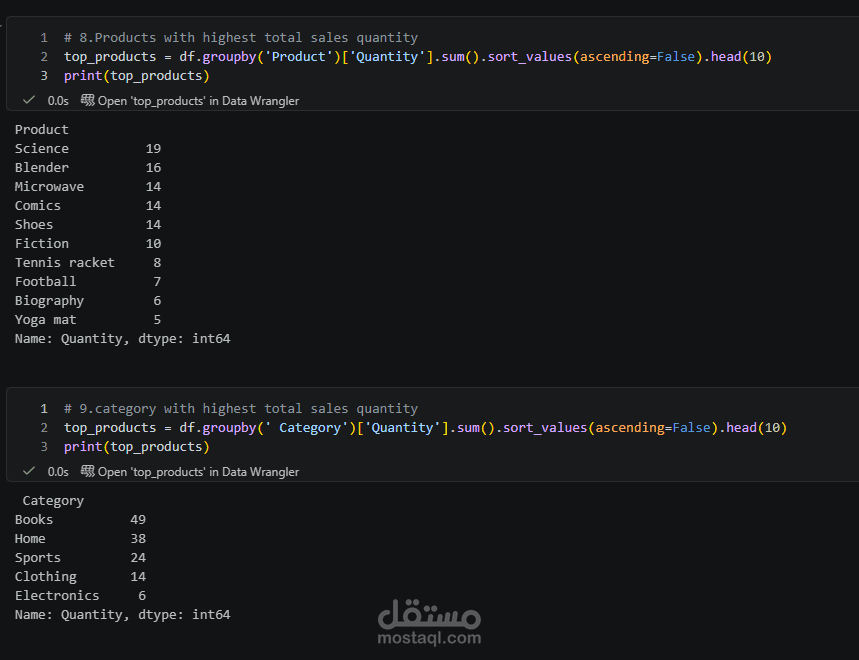
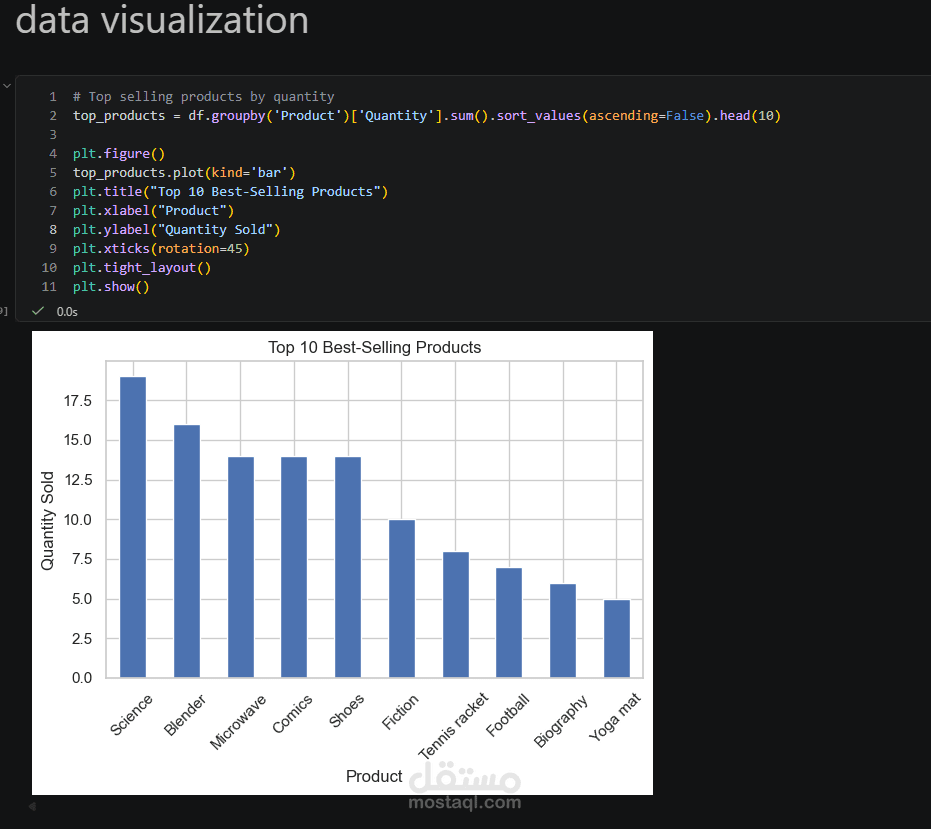
Top customers and best-selling products
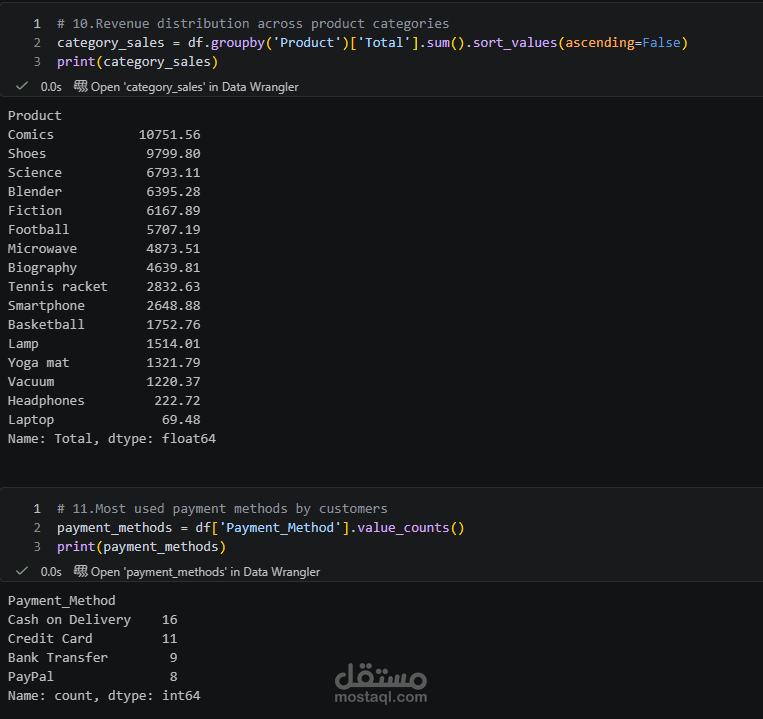
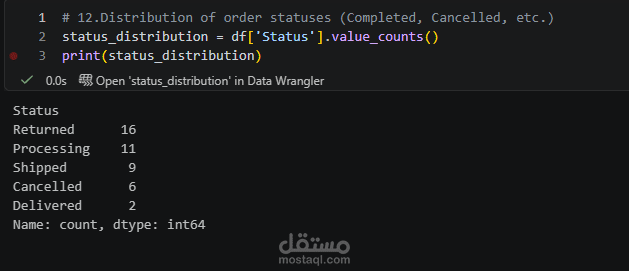
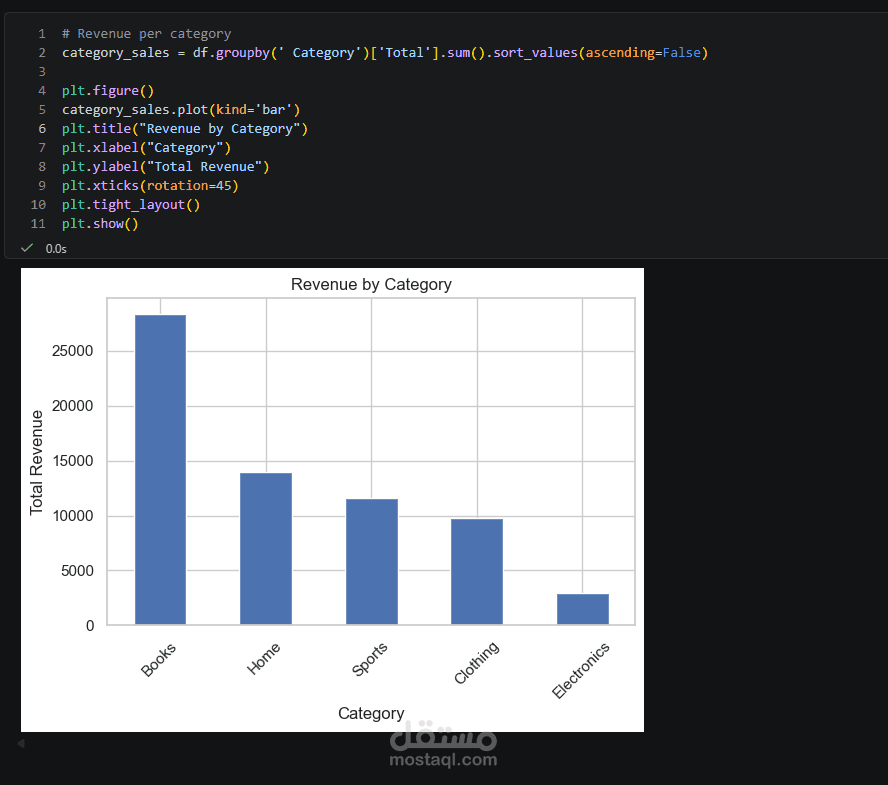
Sales distribution across categories
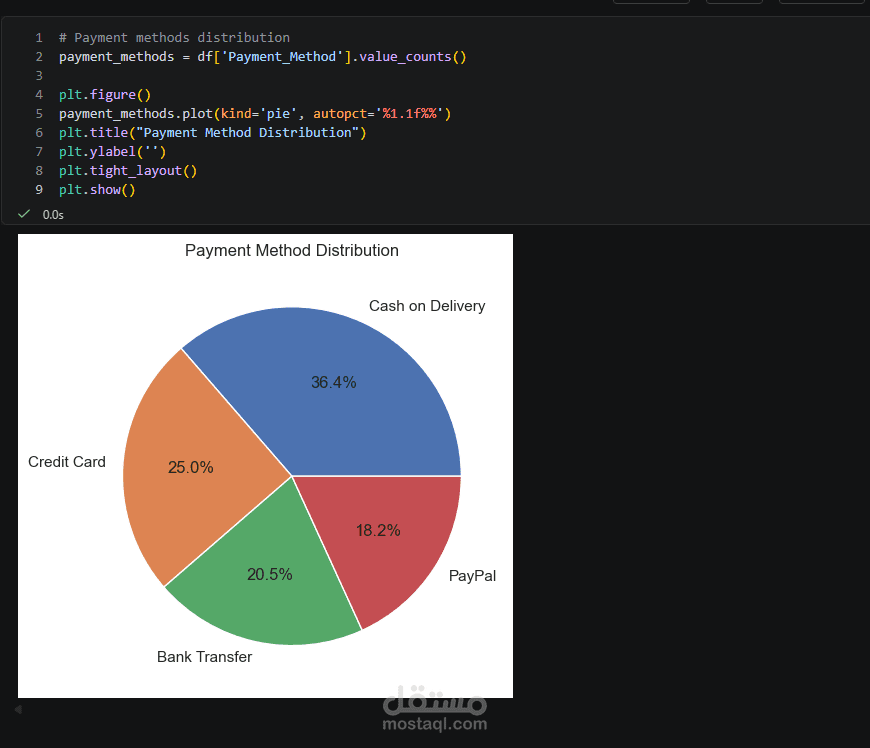
Payment method analysis
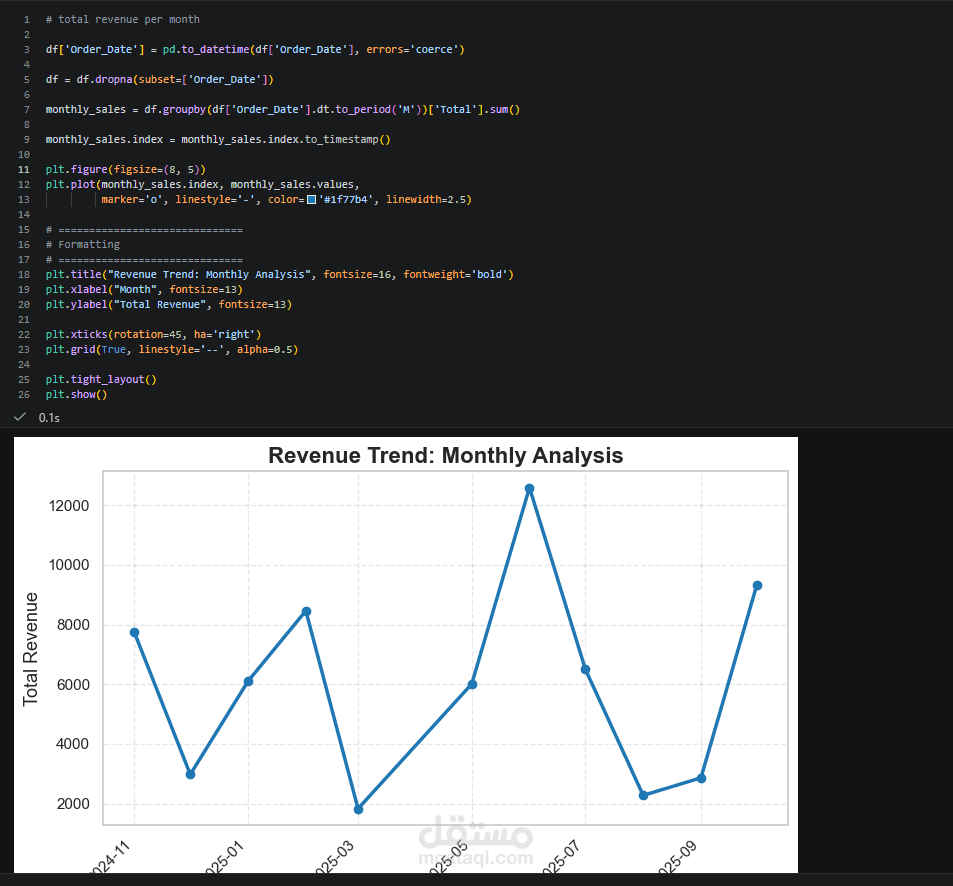
Monthly revenue trends over time
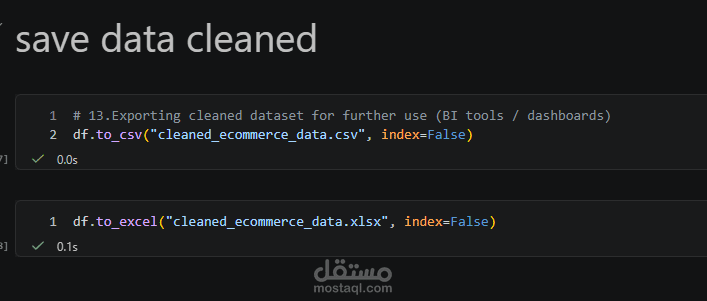
The project also includes data visualization using Matplotlib and Seaborn to present insights in a clear and professional way, along with a structured Excel report/dashboard for better business interpretation.
This project demonstrates skills in:
Data Cleaning & Preprocessing
Exploratory Data Analysis (EDA)
Data Visualization
Business Intelligence thinking
Tools used: Python, Pandas, Matplotlib, Seaborn, Excel