تحليل اداء EGX Stock
تفاصيل العمل
From "Market Noise" to Actionable Insights: EGX Stock Performance Dashboard (Real Data)
The biggest challenge for any investor isn't the lack of data; it’s the "Market Noise." Daily price volatility often obscures true trends, making it time consuming to calculate risk or identify liquidity concentrations.
In this analysis, I focused on the Top 5 Market Leaders in Egypt to provide a comprehensive view of market liquidity and trends:
CIB Egypt
Talaat Moustafa Group
Orascom Construction PLC
Fawry
GB Corp
Key Insights & Findings:
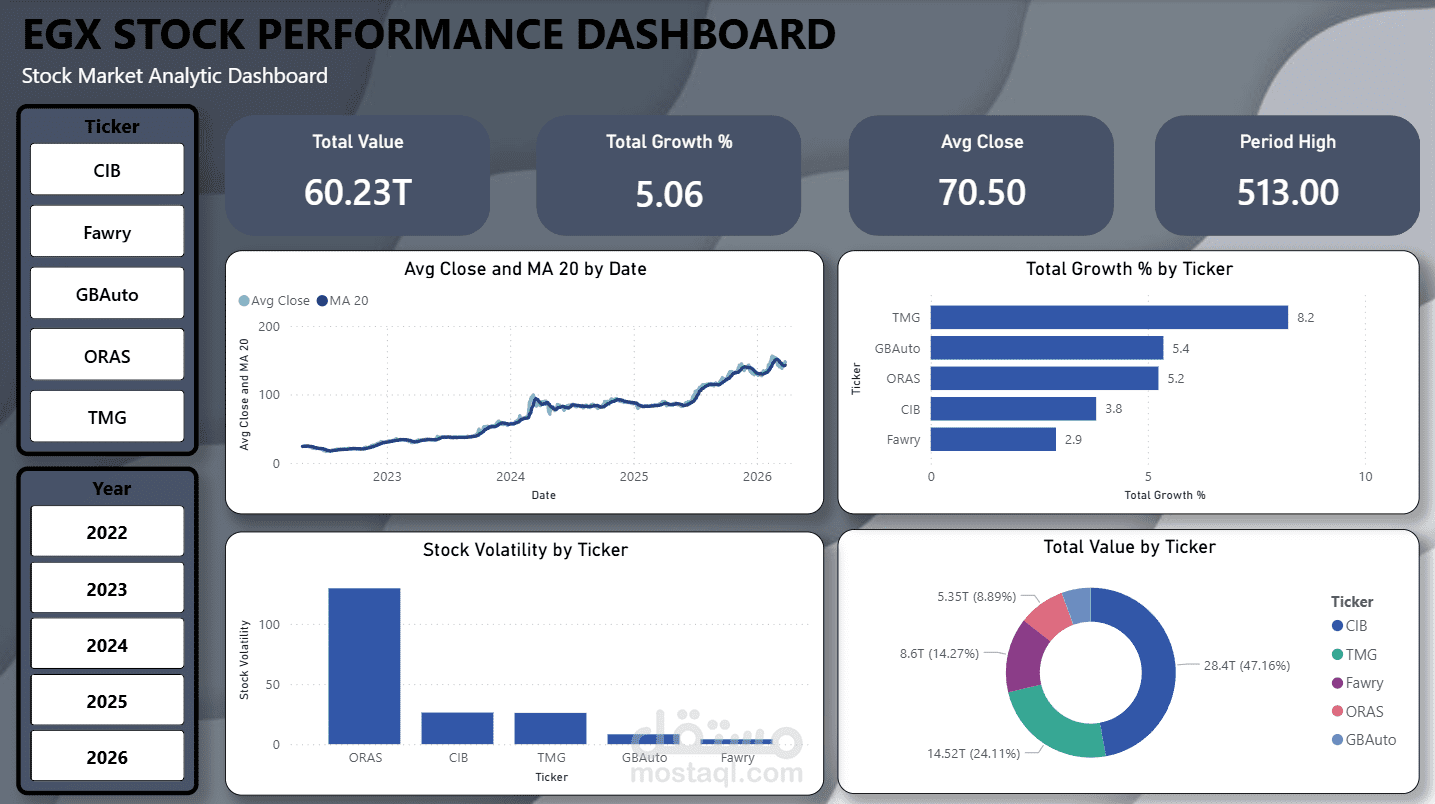
1- Trend Identification: To filter out daily "noise," I integrated the daily price with a 20-Day Moving Average (MA). This allows investors to instantly spot trend reversals and buy/sell signals through price crossovers.
2- Growth Leader: My analysis highlighted TMG (Talaat Moustafa Group) as the top performer, recording the highest growth rate of 8.2%.
3- Risk Assessment: Using volatility deviation analysis, the dashboard identified ORAS (Orascom) as the asset with the highest volatility, providing critical intelligence for risk management.
4- Liquidity Map: Volume analysis confirmed that CIB (Commercial International Bank) is the market "anchor," holding the lion’s share of trading liquidity.
The Technical Engine:
- SQL Views: I started at the backend, extracting and cleaning raw data using SQL Views to ensure an automated and robust data feed for the analytical environment.
- Data Modeling: I architected a high-performance Star Schema, properly relating Fact and Dimension tables to ensure the model handles complex DAX measures seamlessly and efficiently.