Adidas Sales Performance Dashboard
تفاصيل العمل
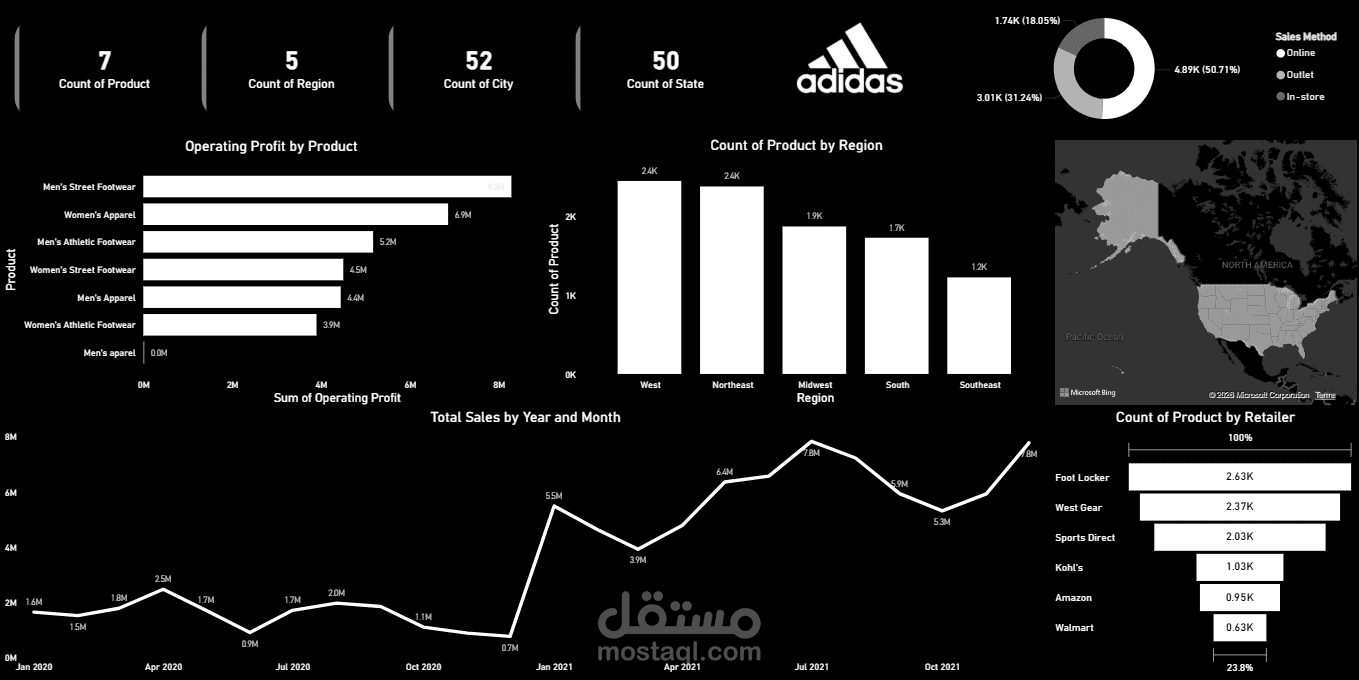
Adidas Sales Performance Dashboard
This dashboard provides a comprehensive overview of sales performance for Adidas products across different regions, retailers, and sales channels. The goal is to highlight key insights about profitability, product distribution, and sales trends over time.
? Key Performance Indicators
At the top of the dashboard, several KPIs summarize the dataset:
• 7 Products analyzed in the dataset
• 5 Regions where sales occur
• 52 Cities included in the analysis
• 50 States covered in the dataset
These indicators provide a quick snapshot of the data scope and geographic coverage.
⸻
? Operating Profit by Product
This chart shows the total operating profit generated by each product category.
Key insights:
• Men’s Street Footwear generates the highest operating profit (~8.3M).
• Women’s Apparel follows with around 6.9M.
• Men’s Athletic Footwear and Women’s Street Footwear also contribute significantly.
• Apparel products generate slightly lower profit compared to footwear categories.
? Insight: Footwear products are the main profit drivers for Adidas in this dataset.
⸻
? Product Distribution by Region
This chart shows how products are distributed across regions:
• West and Northeast have the highest product counts (~2.4K each).
• Midwest and South follow.
• Southeast has the lowest product count (~1.2K).
? Insight: The West and Northeast regions appear to be the most active markets.
⸻
? Sales Method Breakdown
The donut chart shows the sales channels used to sell products:
• In-store sales represent the largest share (~50%).
• Outlet sales account for about 31%.
• Online sales represent roughly 18%.
? Insight: Despite the growth of e-commerce, physical stores still dominate sales in this dataset.
⸻
? Total Sales Trend (2020–2021)
The line chart shows monthly total sales performance.
Key observations:
• Sales fluctuated throughout 2020 with a noticeable dip near the end of the year.
• A strong increase occurs in 2021, with sales reaching peaks around 7–8M.
? Insight: The business experienced significant growth in 2021 compared to 2020.
⸻
? Product Distribution by Retailer
This chart highlights which retailers sell the most products:
Top retailers include:
1. Foot Locker (~2.63K products)
2. West Gear (~2.37K)
3. Sports Direct (~2.03K)
4. Kohl’s
5. Amazon
6. Walmart
? Insight: Foot Locker is the leading retailer
for Adidas products in this dataset.