CRM Sales
تفاصيل العمل
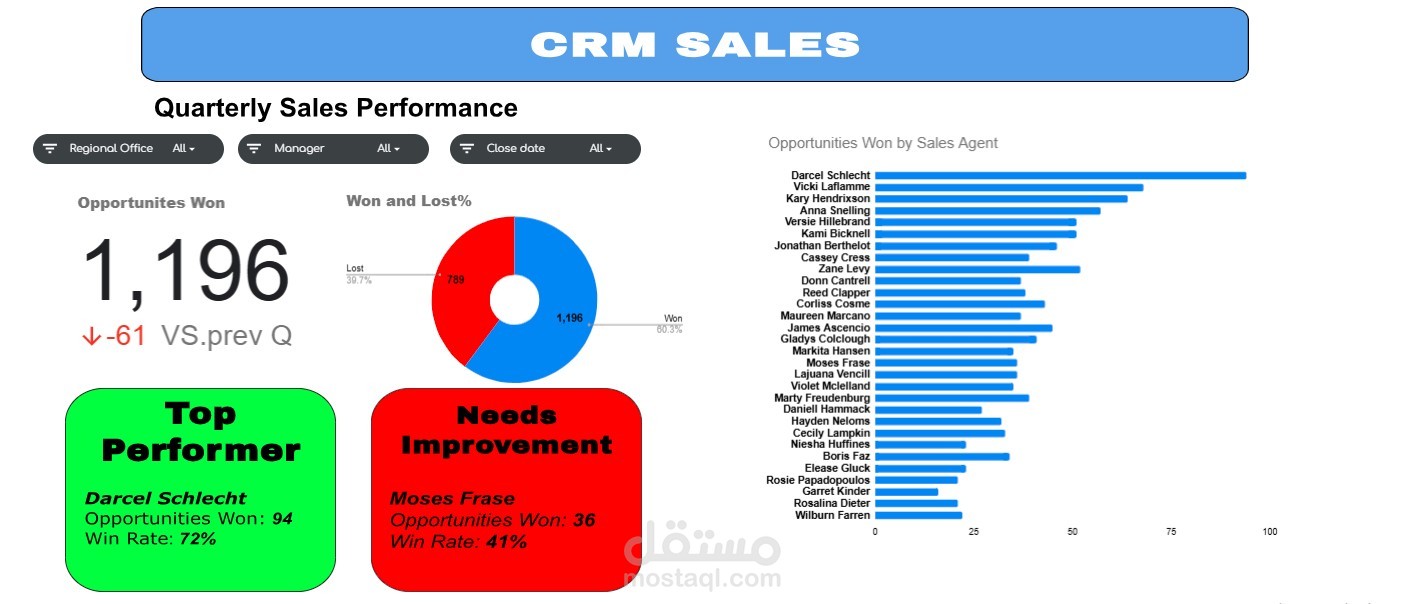
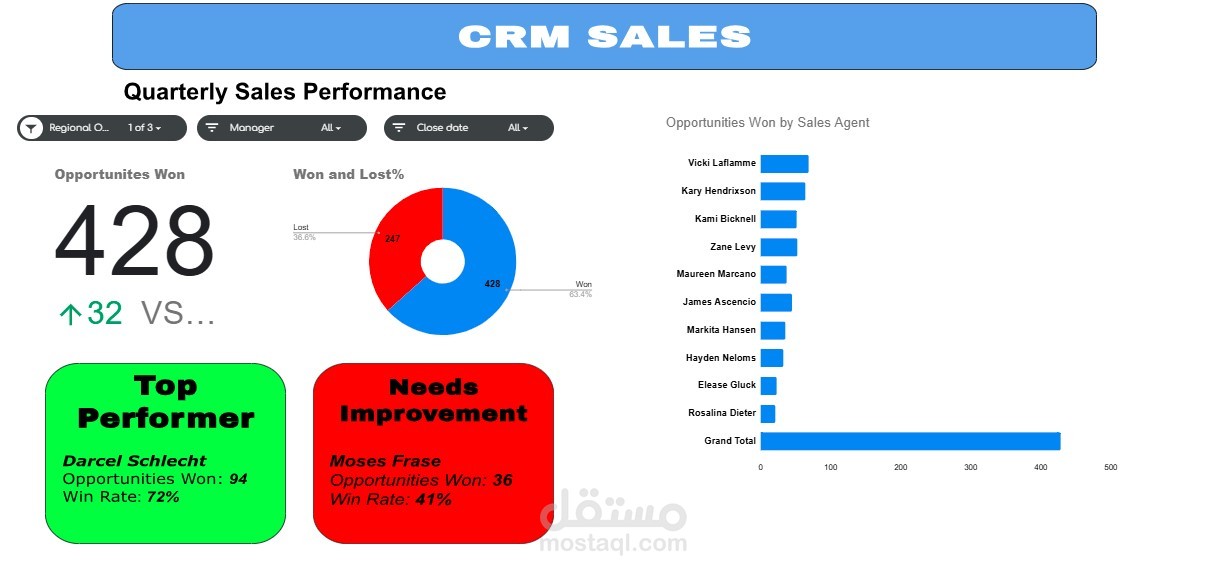
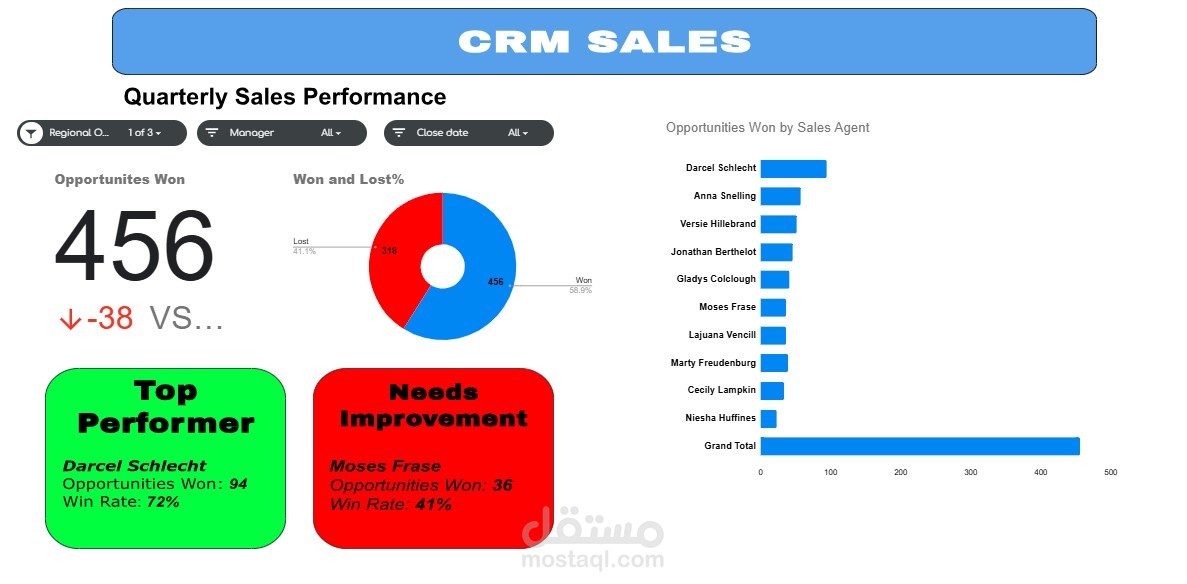
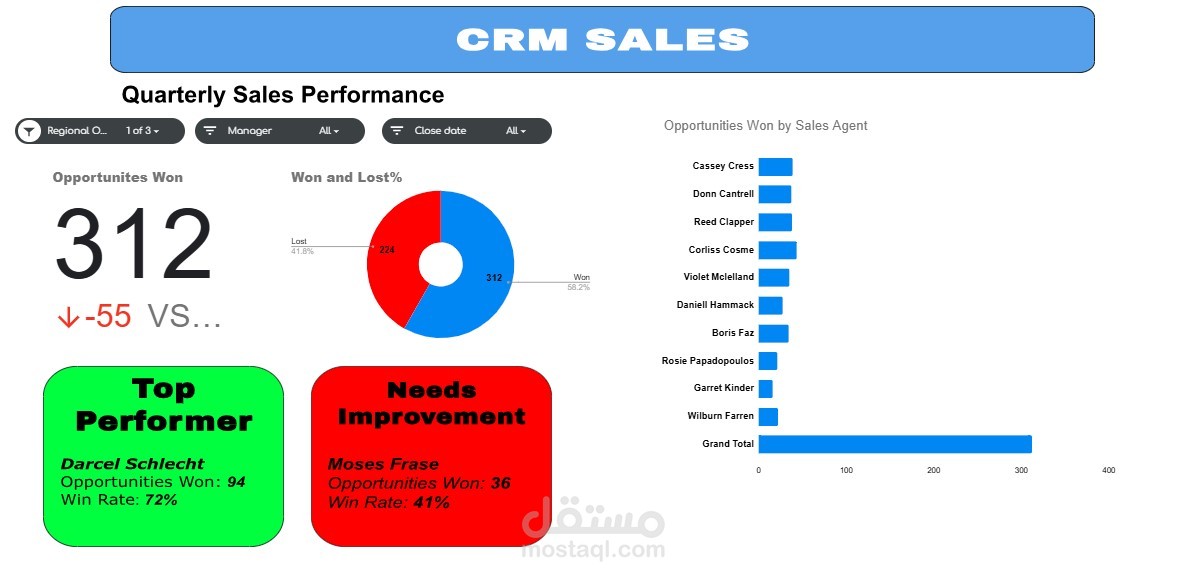
CRM Sales Dashboard – Project Summary
This dashboard provides an overview of sales pipeline performance for a B2B company, tracking opportunities from prospecting to closed/won or lost. The data spans multiple sales agents, products, accounts, and regions, and was cleaned and modeled in Excel before visualization.
Key metrics displayed:
Total opportunities won vs. lost (Win rate: 78%)
Top performer: Darcel Schlecht (94 wins, 72% win rate)
Needs improvement: Moses Frase (36 wins, 41% win rate)
Quarterly comparison: ↓61 vs. previous quarter
Visuals include:
Opportunities won by sales agent (bar chart)
Win/loss percentage (pie chart)
Filterable by manager, close date, and region
Insights:
A small group of top agents drives the majority of closed revenue.
Win rate is strong overall, but performance varies significantly by agent.
The decline vs. previous quarter suggests a need to review pipeline health and agent support.