HR Analytics Dashboard (Sample Project)
تفاصيل العمل
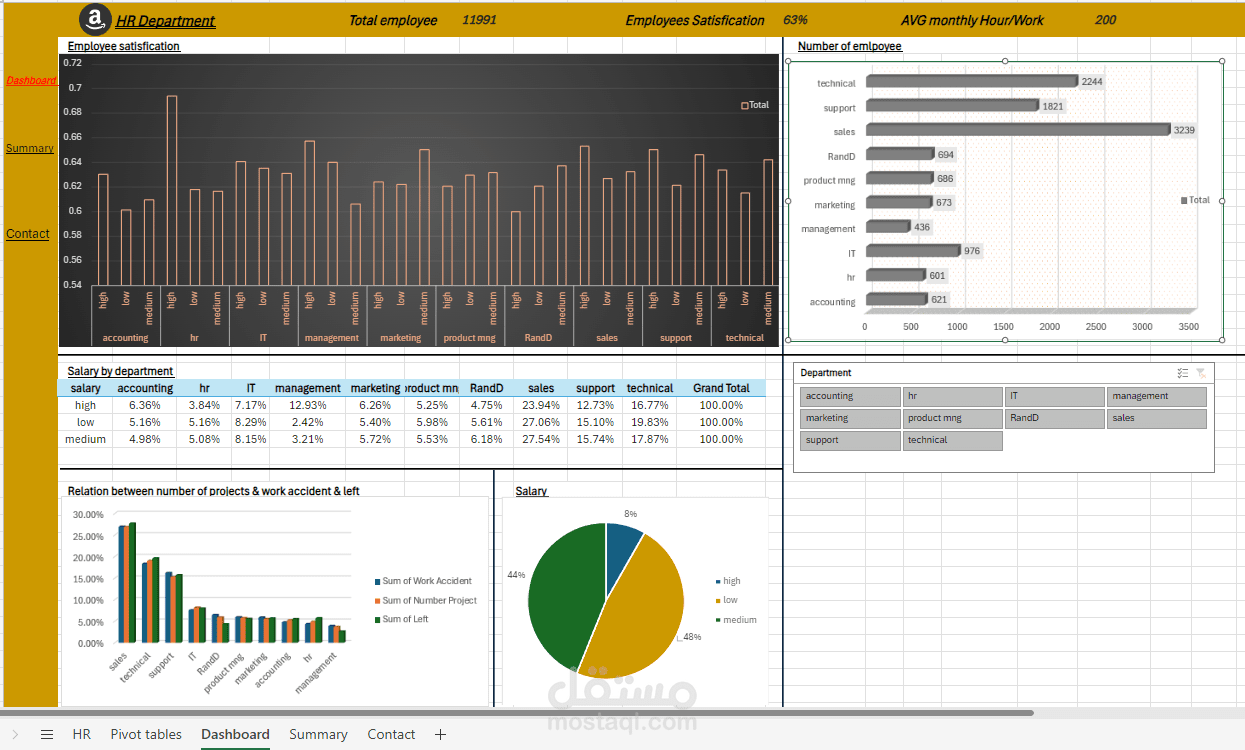
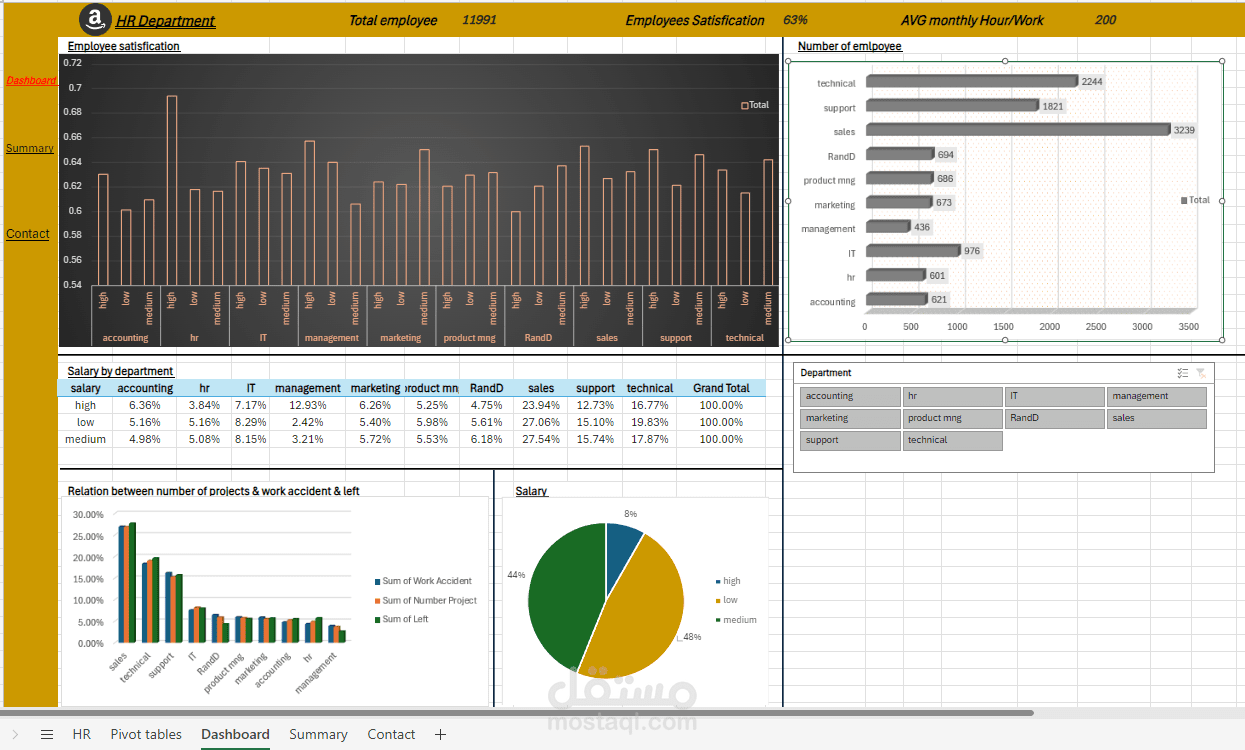
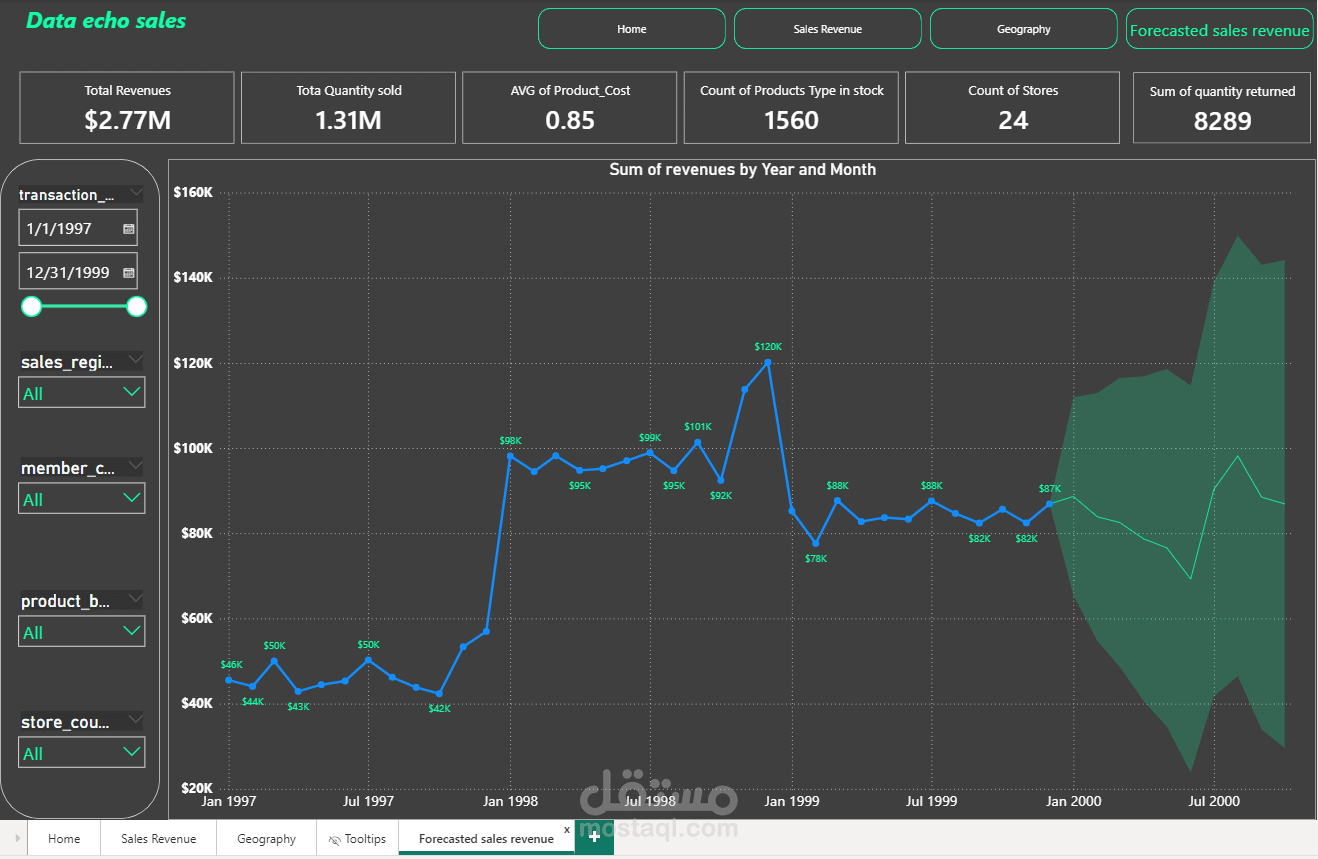
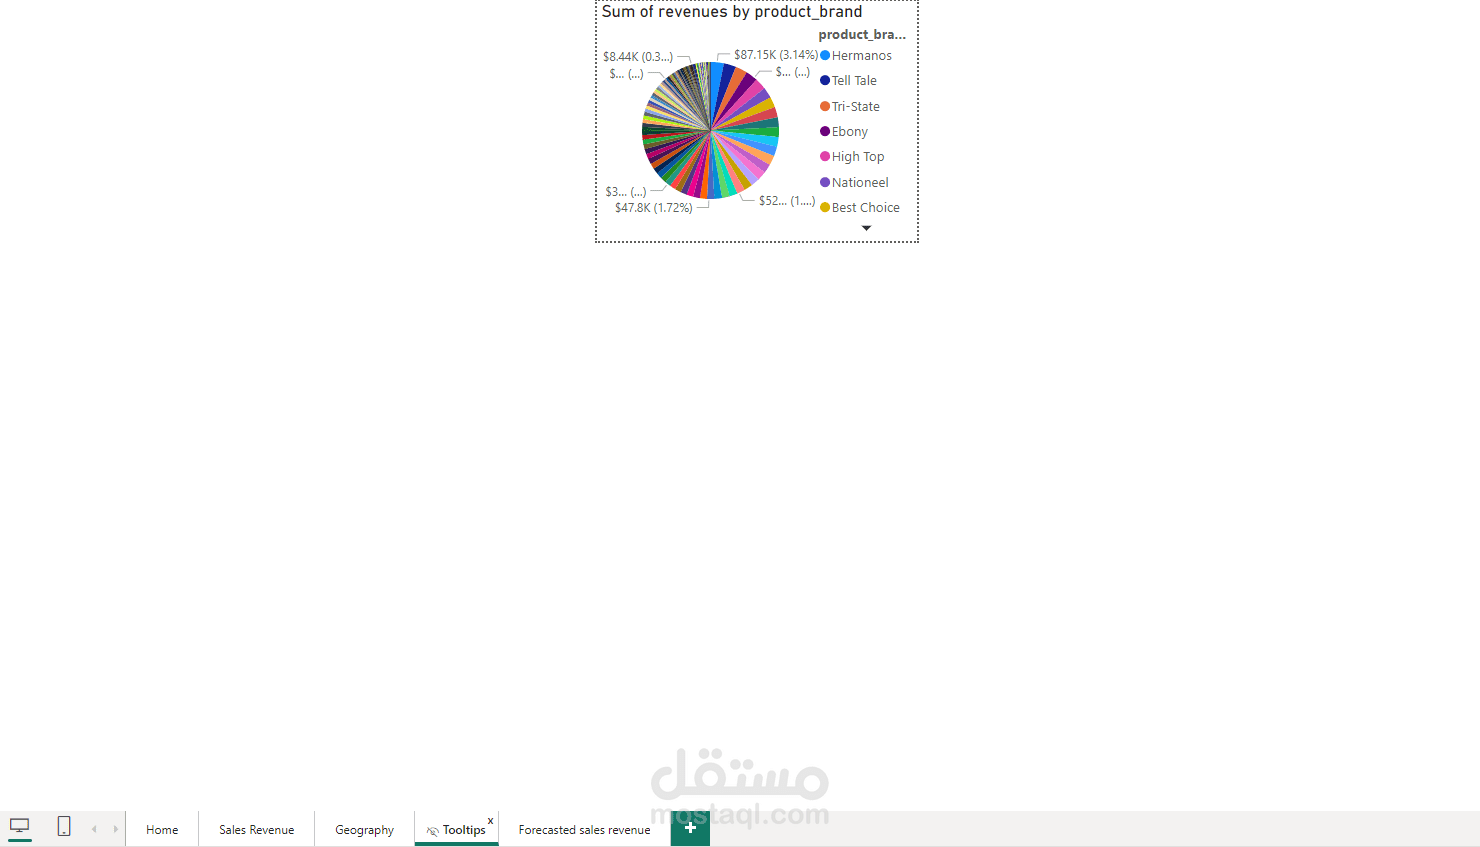
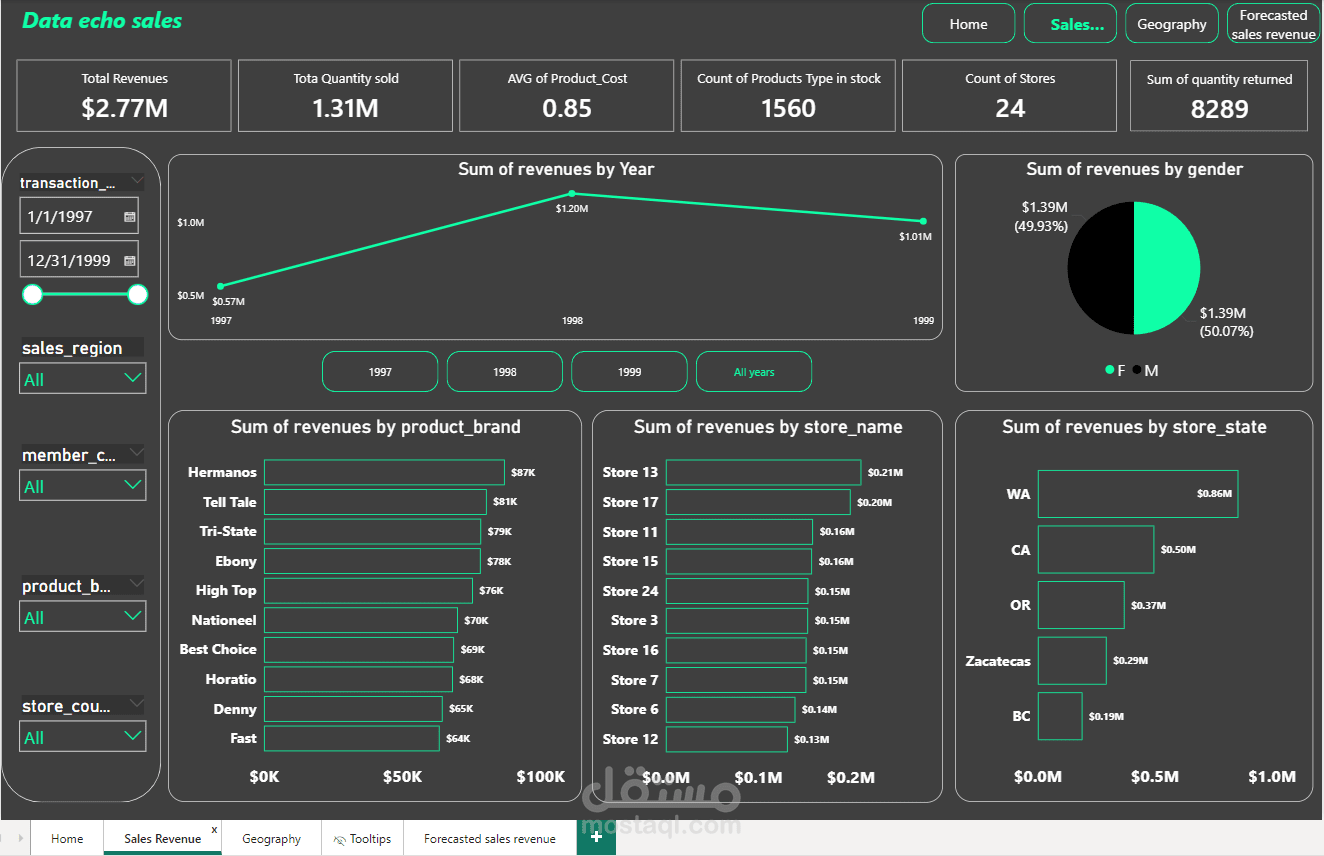
Developed an interactive HR Analytics dashboard to analyze employee data and deliver actionable insights on workforce performance, satisfaction, and department distribution.
The dashboard was designed to help understand key HR metrics and support data-driven decision-making.
Key Features:
Built a multi-section interactive dashboard for HR analysis
Analyzed employee satisfaction levels across different departments
Visualized employee distribution across departments
Investigated relationships between workload, number of projects, and employee retention
Created key performance indicators (KPIs) such as total employees, average monthly working hours, and satisfaction rate
Designed interactive filters and dynamic visuals for better data exploration
Tools Used:
Excel
Data Preprocessing
Data Analysis
Pivot Tables
Data Visualization