Football Data Analysis & Interactive Dashboard (Microsoft Excel & Tableau | UCL Insights)
تفاصيل العمل
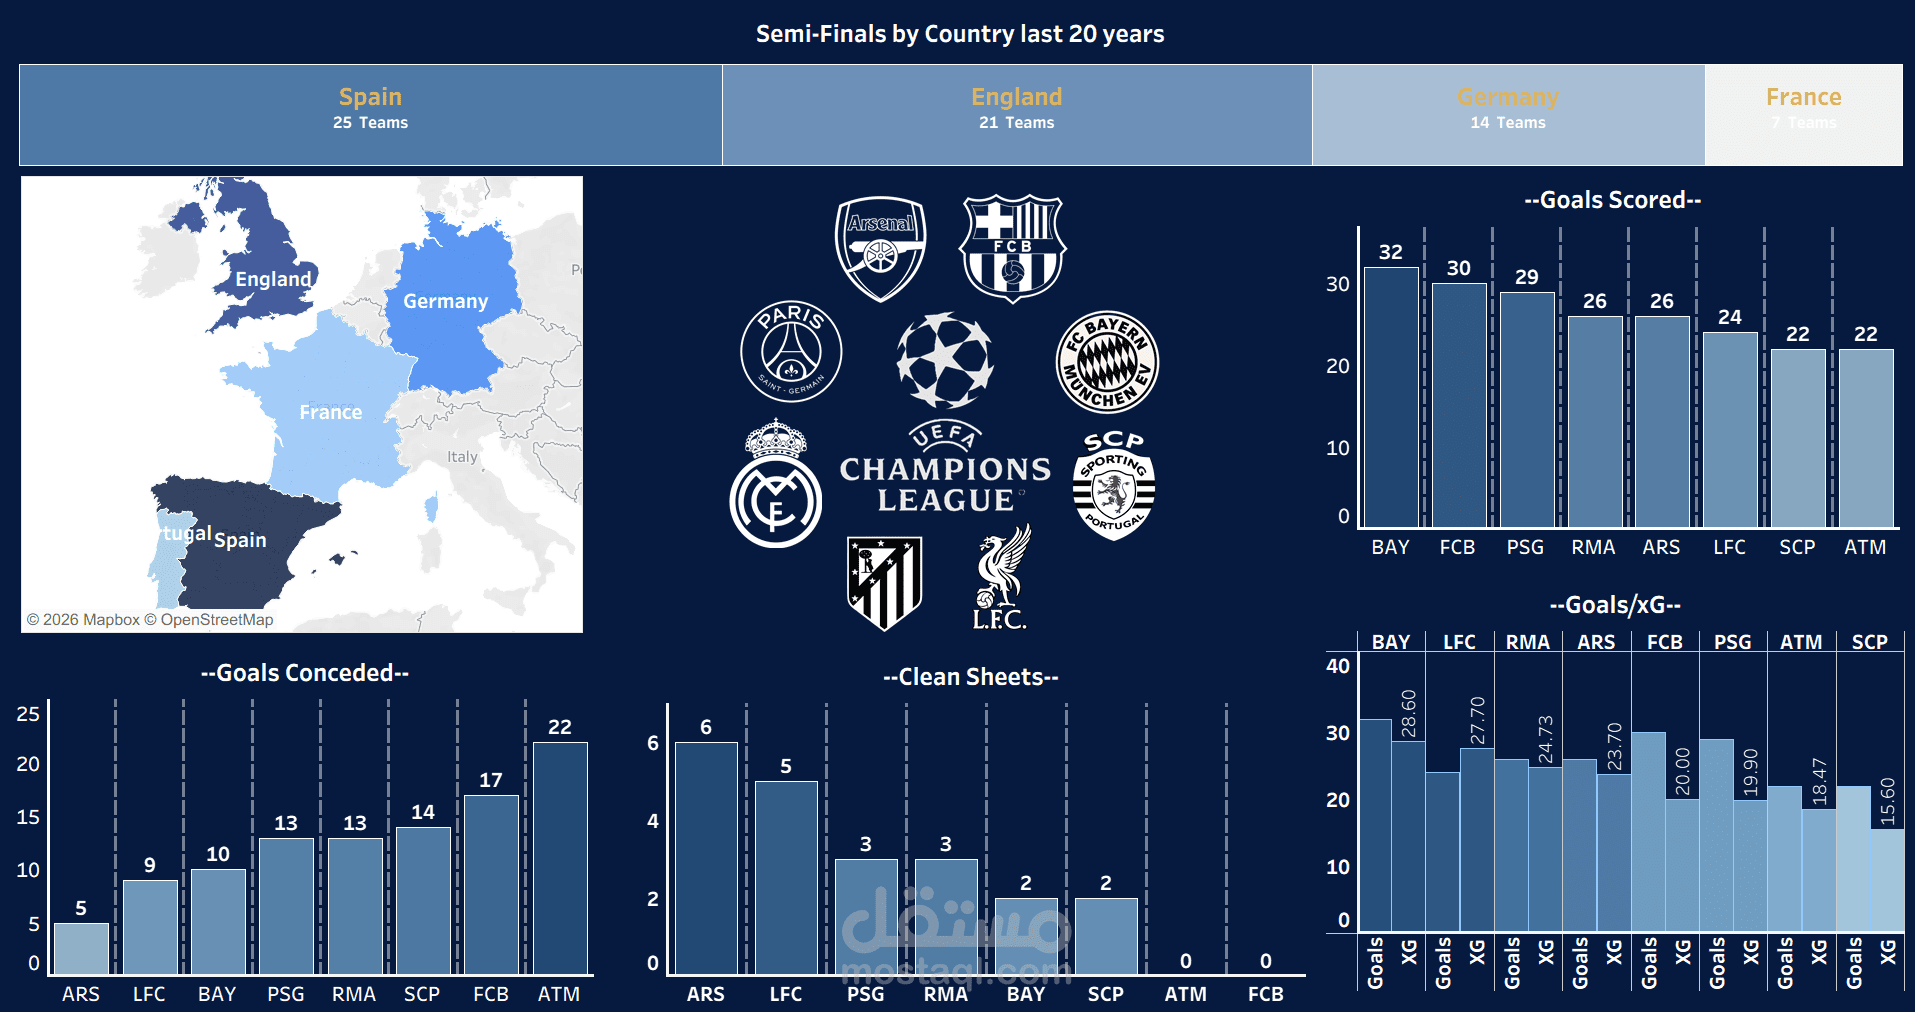
Project Overview:
Developed an interactive Power BI dashboard to analyze UEFA Champions League 8 teams of quarter final performance over the last 20 years.
Key Features:
Analyzed team performance across top European leagues (Spain, England, Germany, France)
Visualized key metrics such as:
Goals Scored
Goals Conceded
Clean Sheets
Goals vs Expected Goals (xG)
Built a geographic map to highlight country-level performance
Designed a clean, modern, and user-friendly dashboard layout
Tools & Technologies:
Power BI | Data Visualization | Data Analysis
Outcome:
The dashboard provides clear insights into team performance trends and comparisons, helping users easily explore and understand football analytics data.