Adidas Sales Analysis Dashboard
تفاصيل العمل
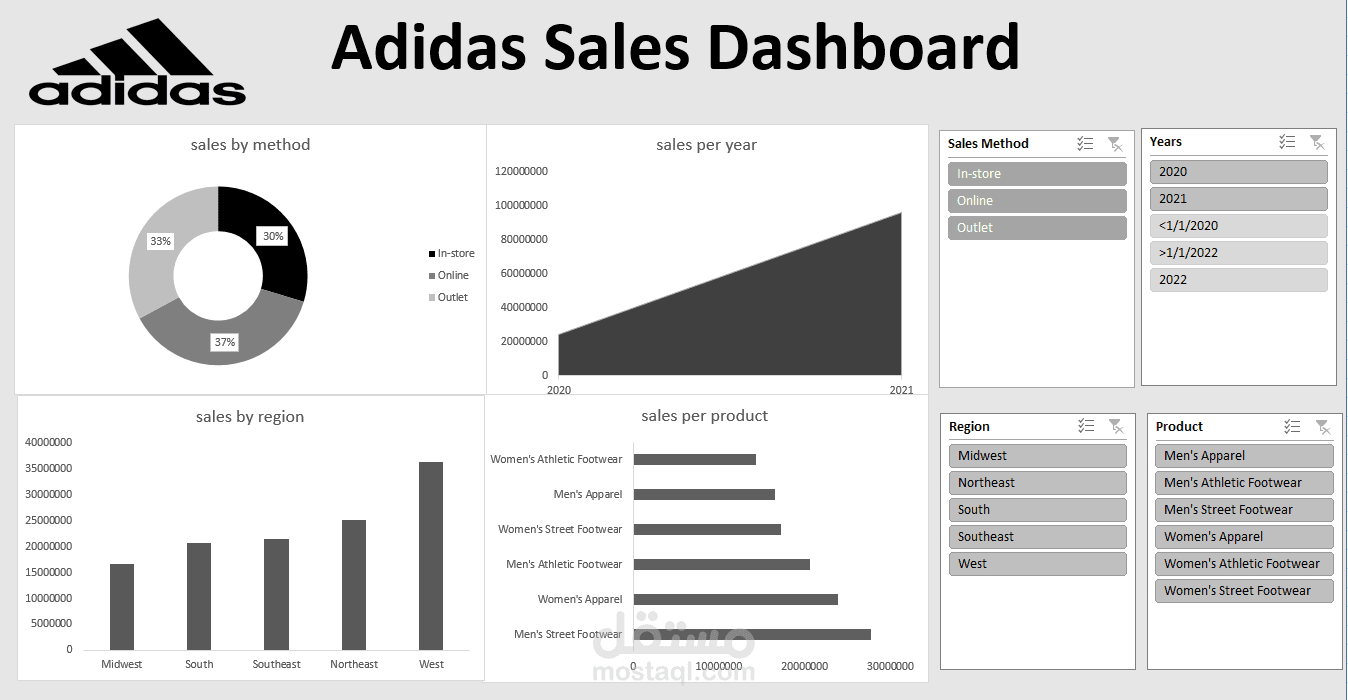
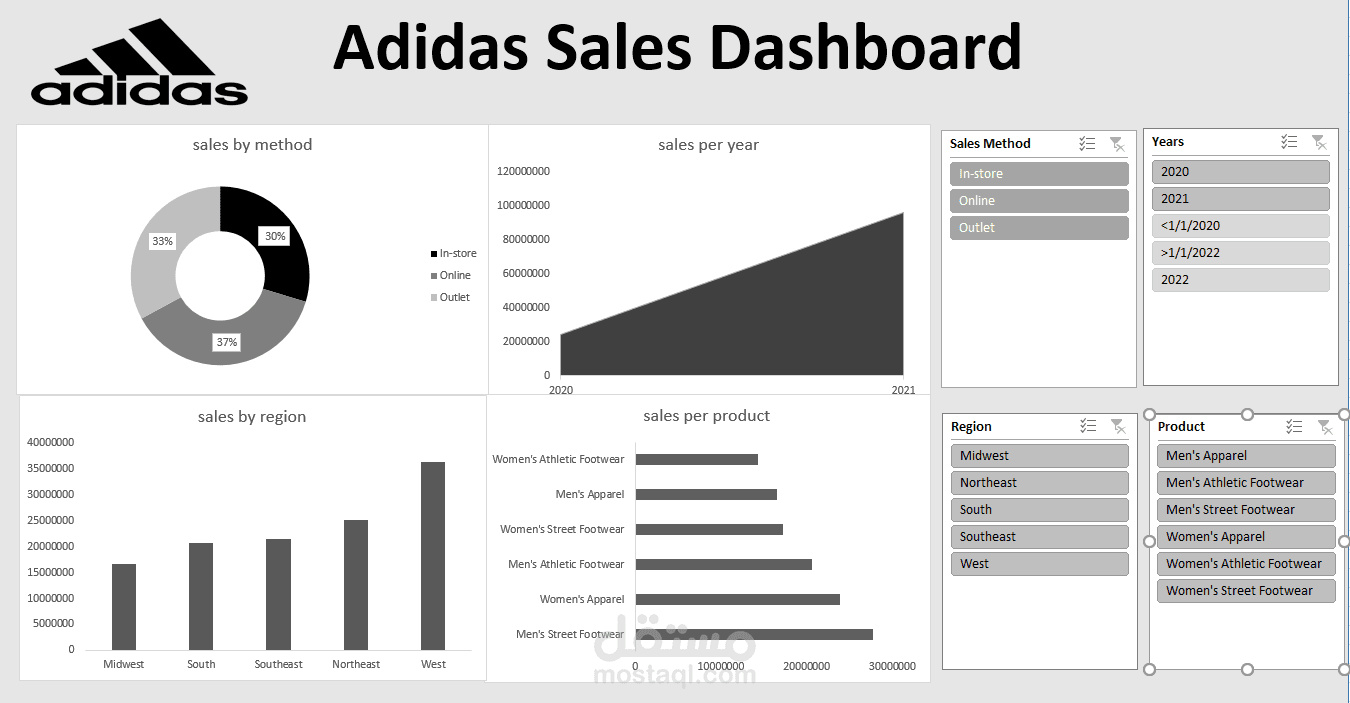
designed an interactive sales dashboard using Microsoft Excel to analyze Adidas sales data in a clear and visually appealing way.
This dashboard helps in understanding sales performance and supports data-driven decision-making.
Key Features:
Sales analysis by sales method (In-store, Online, Outlet)
Yearly sales trends visualization
Regional sales performance analysis
Product-level sales comparison
Interactive filters (Slicers) for dynamic data exploration
The dashboard was built using Excel tools such as Pivot Tables, Pivot Charts, and Slicers to ensure flexibility and ease of use.