Retail Performance & Sales Insights Dashboard
تفاصيل العمل
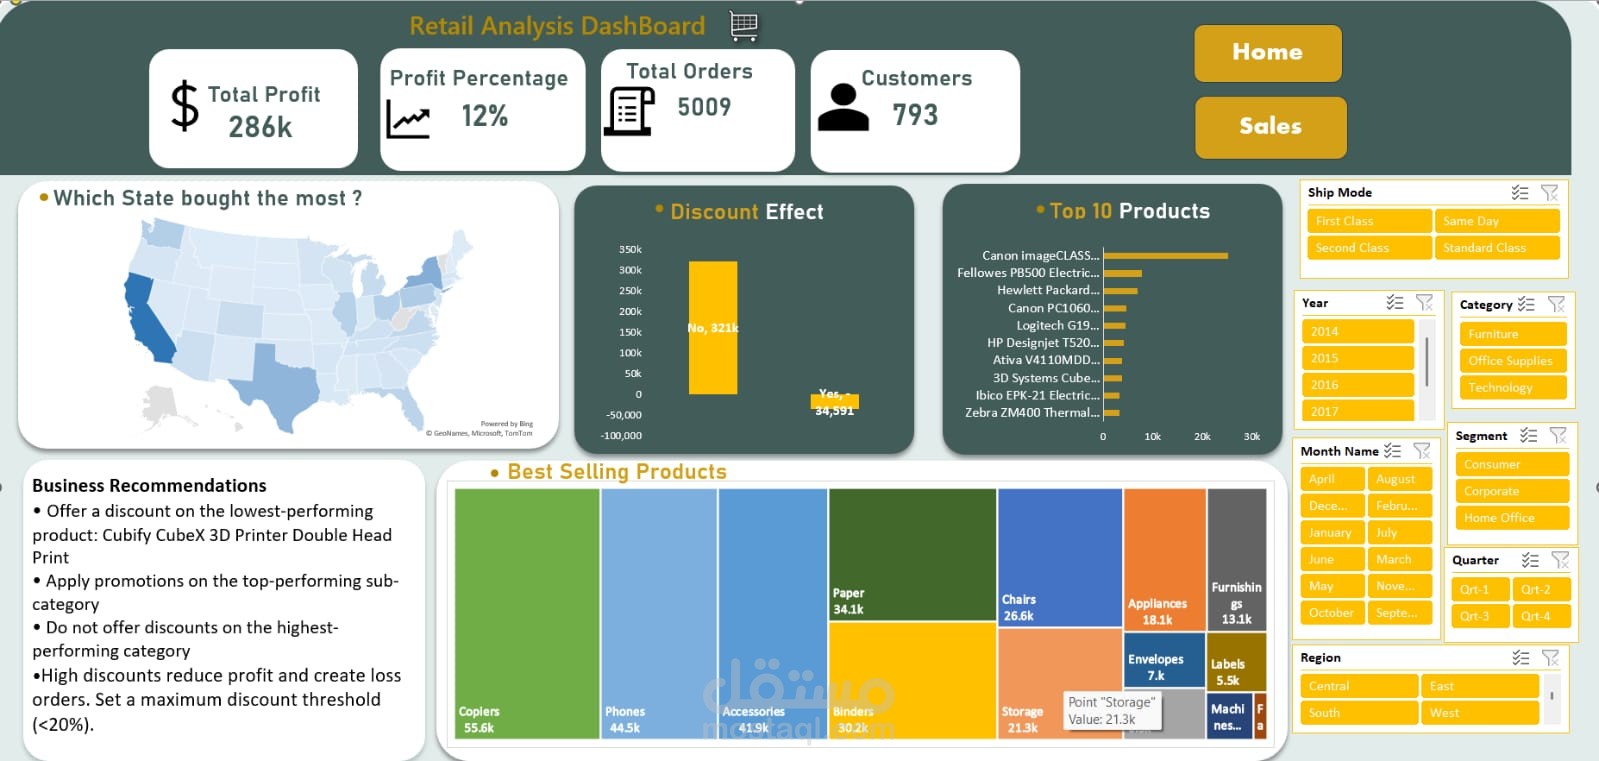
:Description
This dashboard provides a comprehensive overview of retail performance, combining key financial metrics with customer and sales insights.
الداشبورد دي بتعرض أهم مؤشرات الأداء زي:
إجمالي الربح (Total Profit)
نسبة الربح (Profit Percentage)
عدد الطلبات والعملاء
It also highlights geographical performance through a map showing which states generate the highest sales, helping in identifying strong and weak markets.
كمان بتوضح تأثير الخصومات (Discount Effect) على الأرباح، وبتأكد إن الخصومات العالية ممكن تقلل الربحية وتسبب خسائر.
The dashboard includes:
Top 10 Products to track best-performing items
Best Selling Products using a visual treemap
Dynamic filters مثل (Year, Category, Segment, Region) عشان تسهل تحليل البيانات من أكتر من زاوية
? بالإضافة لكده، فيها Business Recommendations بتساعد في اتخاذ قرارات زي:
تحسين المنتجات الضعيفة
استخدام العروض بشكل ذكي
تقليل الخصومات الزائدة
Overall, the dashboard helps decision-makers understand sales trends, optimize pricing strategies, and improve overall business performance.