Pizza Sales Data Analysis
تفاصيل العمل

# ? Pizza Sales Data Analysis (Python & Excel)
## ? Project Overview
This project analyzes a pizza sales dataset using **Python and Excel** to uncover key business insights such as revenue trends, best-selling pizzas, and customer behavior.
---
## ? Dataset Description
The dataset includes:
* `order_id` → Unique ID for each order
* `pizza_name` → Name of the pizza
* `pizza_category` → Category (Classic, Supreme, Chicken, Veggie)
* `pizza_size` → Size (S, M, L, XL)
* `quantity` → Number of pizzas ordered
* `unit_price` → Price per pizza
* `total_price` → Total order value
* `order_date` → Order date
* `order_time` → Order time
---
## ? Objectives
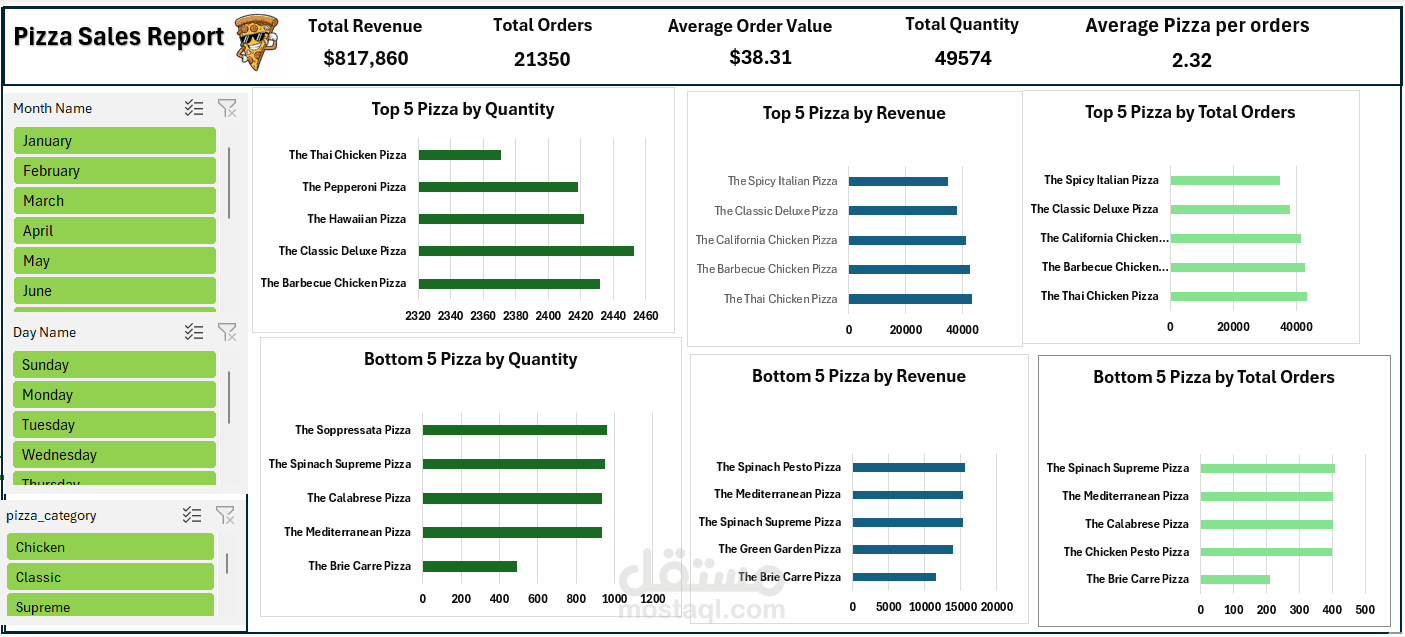
* Identify most popular pizzas ?
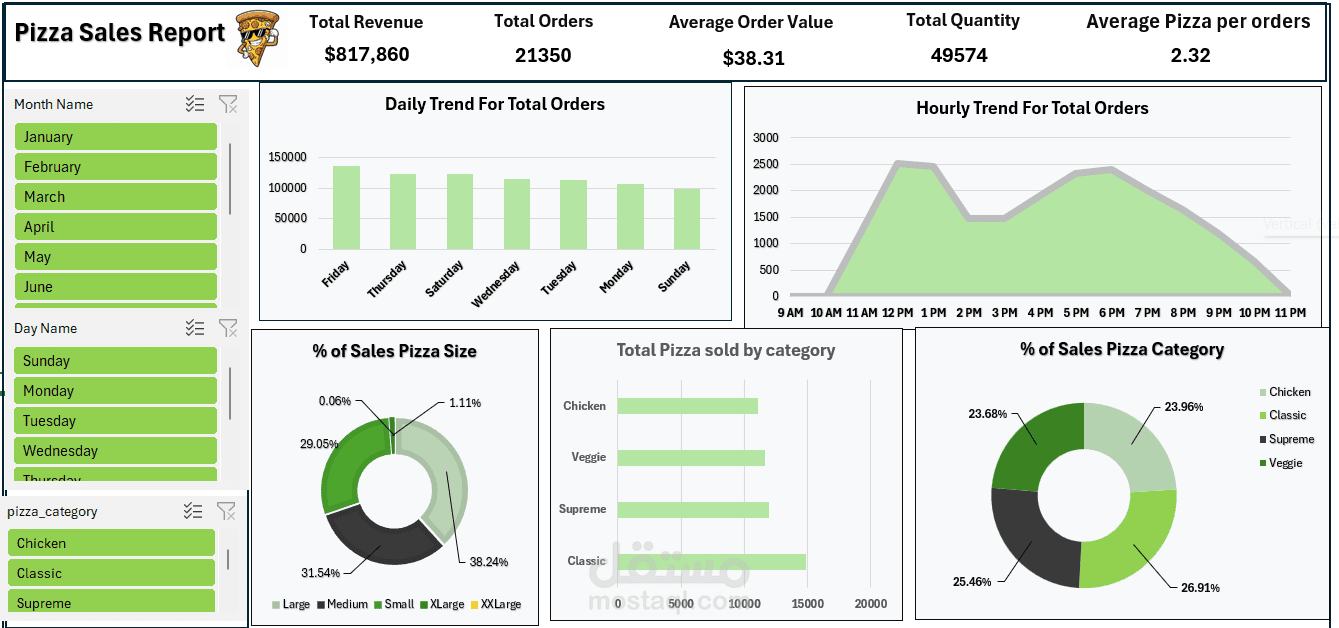
* Analyze revenue by category ?
* Detect peak order times ⏰
* Track monthly sales trends ?
---
## ?️ Tools Used
### ? Python
* Pandas → Data cleaning & analysis
* Matplotlib → Visualization
### ? Excel
* Pivot Tables
* Charts (Bar, Line, Pie)
* Data Cleaning
* Basic KPIs
---
## ? Analysis Performed
### In Python:
* Top 5 pizzas by revenue
* Top 5 pizzas by quantity
* Revenue by category
* Sales by month, day, and hour
### In Excel:
* Pivot tables for category & revenue
* Monthly sales trends
* Category distribution charts
* KPI dashboard
---
## ? Key Insights
* Classic category generates the highest revenue
* Some pizzas are popular but low in profit
* Peak ordering hours are in the evening
* Sales show variation across months
---
## ? How to Use
### Python:
1. Load dataset using Pandas
2. Clean and transform data
3. Run analysis scripts
4. Visualize results
### Excel:
1. Open the dataset in Excel
2. Create Pivot Tables
3. Build charts for insights
4. Design a simple dashboard
---
## ? Future Improvements
* Build interactive dashboard (Power BI)
* Apply Machine Learning for predictions
* Automate reports
---
## ?? Author
Ismail Wassal (Python)
Mohamed Abdelghany (Excel)