Retail Sales Performance Dashboard
تفاصيل العمل
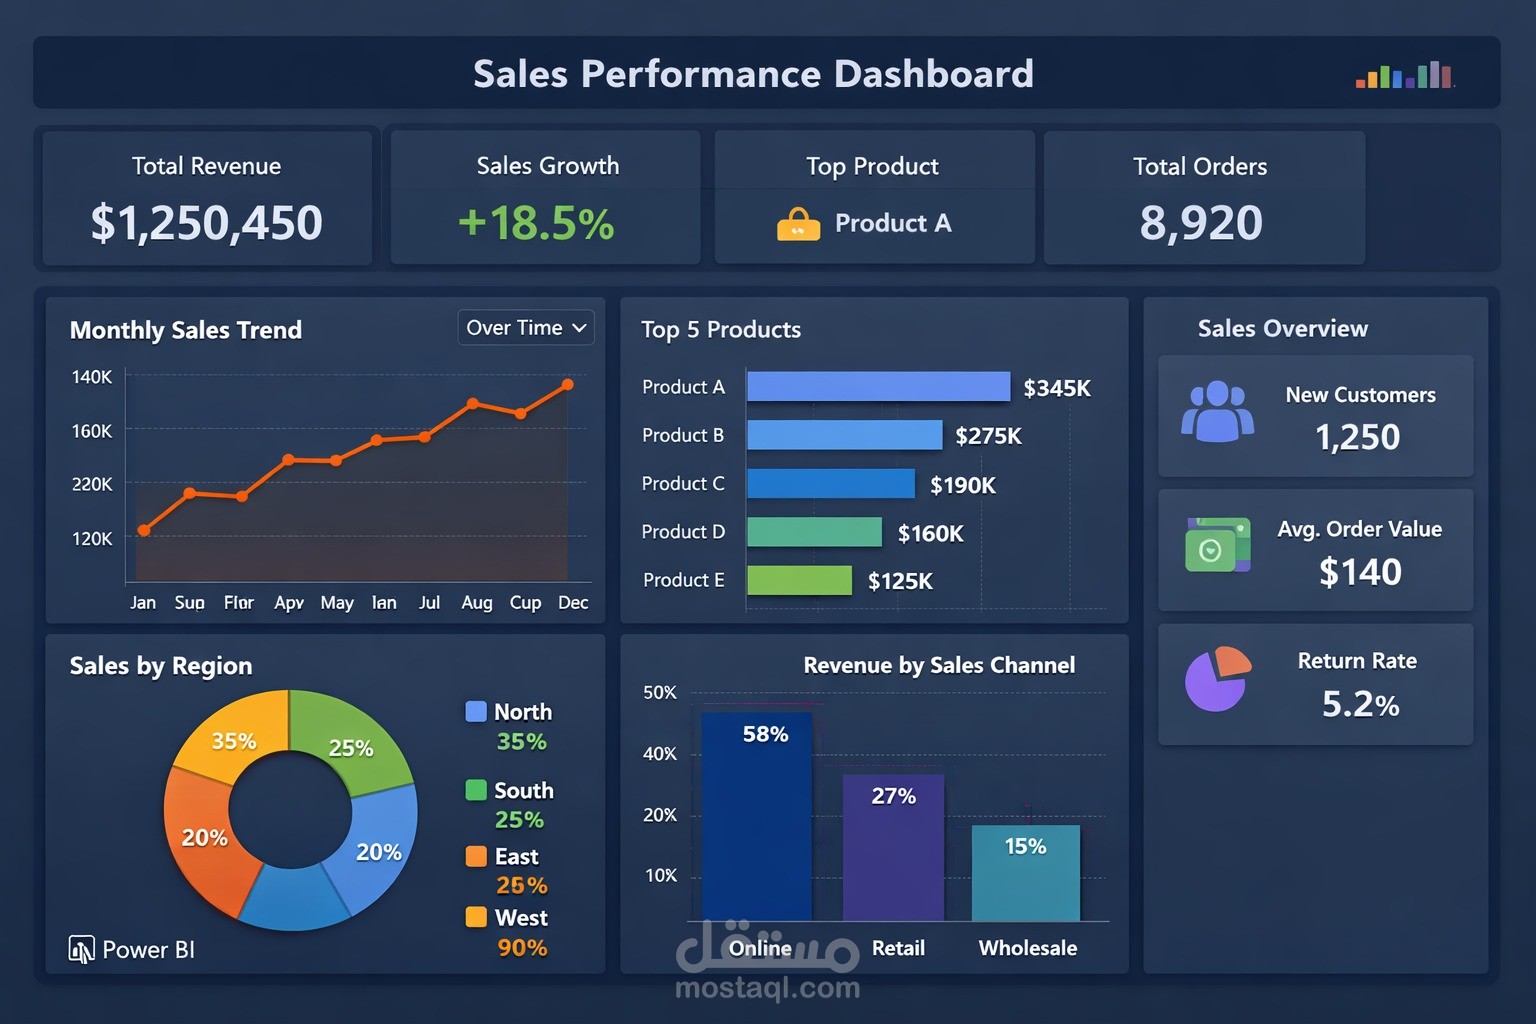
This project showcases a comprehensive Retail Sales Dashboard designed to provide insights into a company's sales performance.
The dashboard includes key metrics such as Total Revenue, Sales Growth, Top Products, and Total Orders. Using SQL and Excel, the sales data was cleaned and organized to ensure accuracy.
Visual analytics include:
Monthly Sales Trend: Line graph showing sales over time
Top 5 Products: Bar chart of highest-selling items
Sales by Region: Donut chart showing performance across regions
Revenue by Sales Channel: Column chart comparing online, retail, and wholesale channels
Additional KPIs: New customers, average order value, and return rate
This dashboard demonstrates my ability to analyze raw data, extract meaningful insights, and present them visually in a clear, professional, and actionable way for business decision-making.
Skills / Tools Used:
SQL, Excel, Data Cleaning, Data Analysis, Dashboards, Data Visualization