SUPPLY CHAIN DASHBOARD
تفاصيل العمل
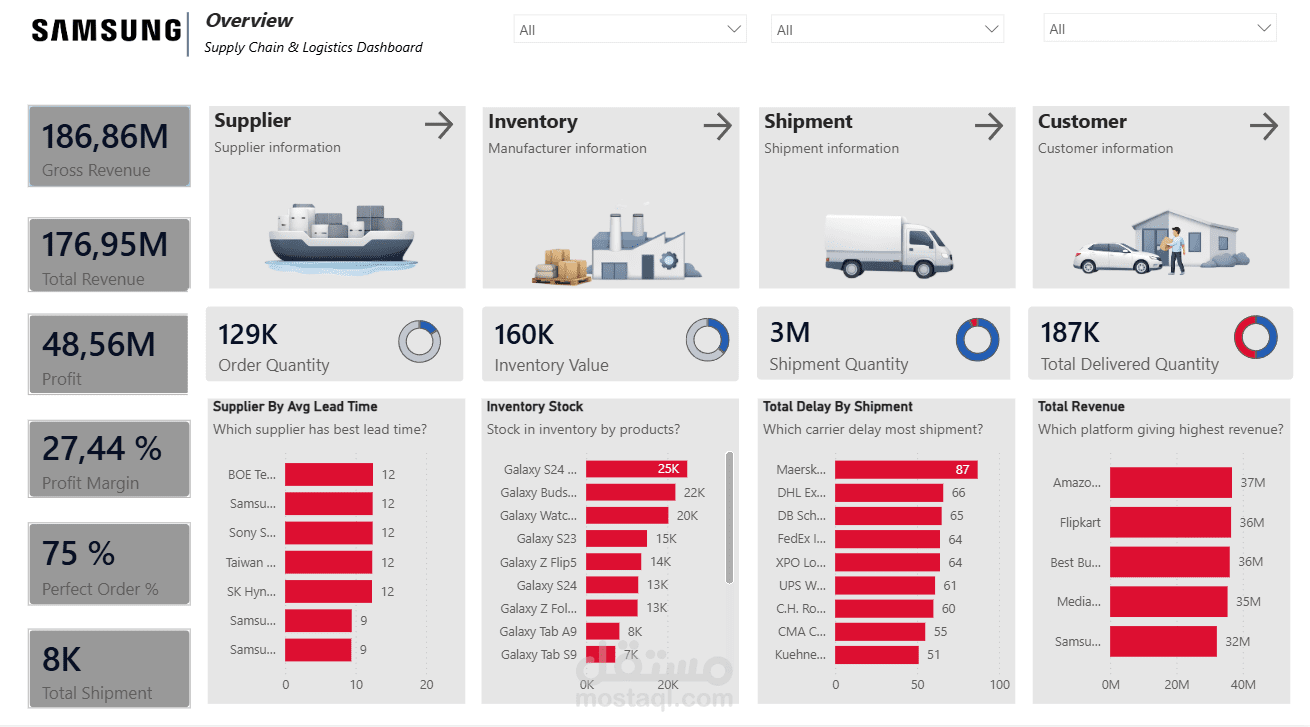
Analyzing operational performance end-to-end for Samsung!
Here’s what I uncovered:
Financial Snapshot:
Gross Revenue: 186.86M
Total Revenue: 176.95M
Profit: 48.56M | Profit Margin: 27.44%
Operational Insights:
▪︎ Perfect Order Rate: 75% – 25% of orders had delays or defects, highlighting opportunities to improve delivery accuracy.
▪︎ Inventory Management: Top-stocked products include Galaxy S24 (25K) and Galaxy Buds (22K), showing strategic focus on high-demand items.
▪︎ Shipment Performance: Maersk led with 87 delayed shipments, followed by DHL and DB Schenker, suggesting areas to optimize carrier performance.
▪︎ Revenue by Platform: Amazon leads at 37M, closely followed by Flipkart and Best Buy (~36M each), demonstrating the importance of multi-platform distribution.
Key Takeaways:
▪︎ Improving carrier efficiency and addressing delayed shipments can raise perfect order rates.
▪︎ Optimizing inventory allocation could free up working capital while maintaining service levels.
▪︎ Multi-platform sales strategy is strong, with slight revenue advantages on Amazon.
This dashboard demonstrates how data-driven insights can directly inform supply chain decisions, from procurement to delivery.
Visualizations include KPI cards, bar charts, and trend filters by year, quarter, and month, giving a clear 360° view of performance.