Sales & Marketing Analysis Dashboard | Power BI
تفاصيل العمل
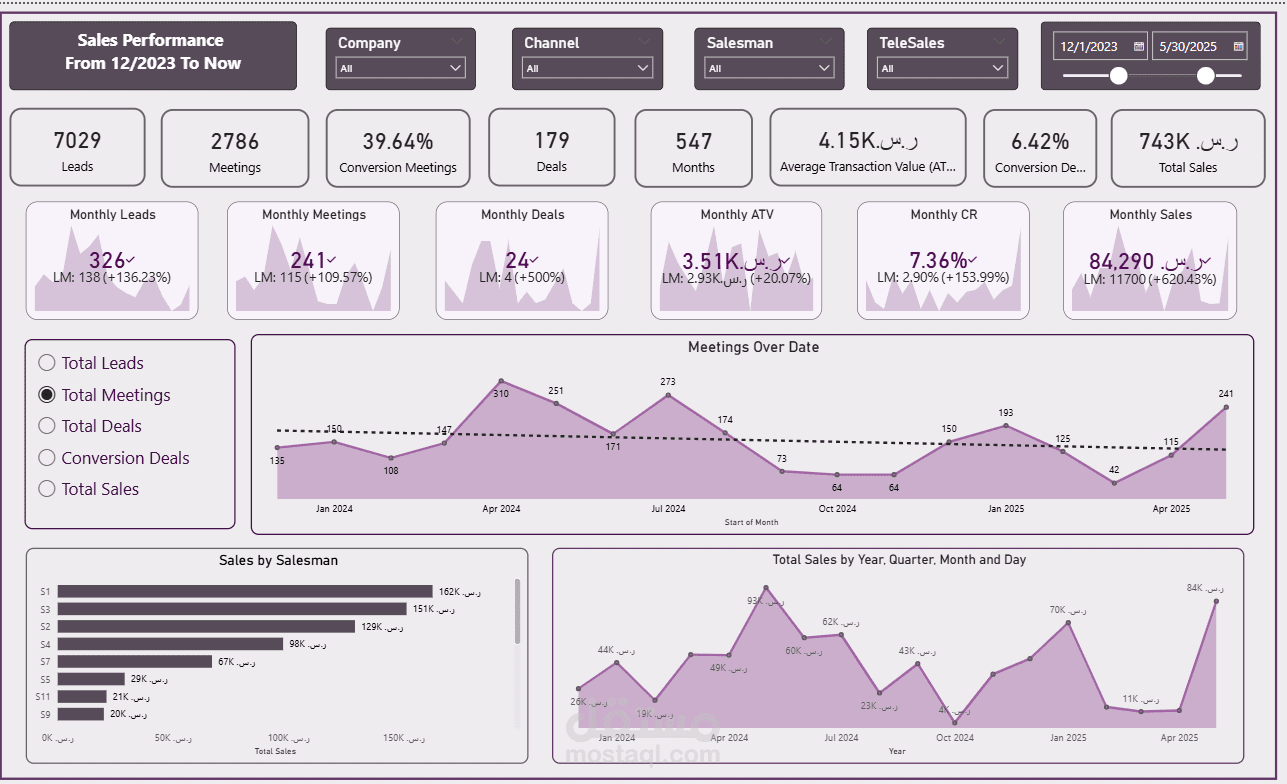
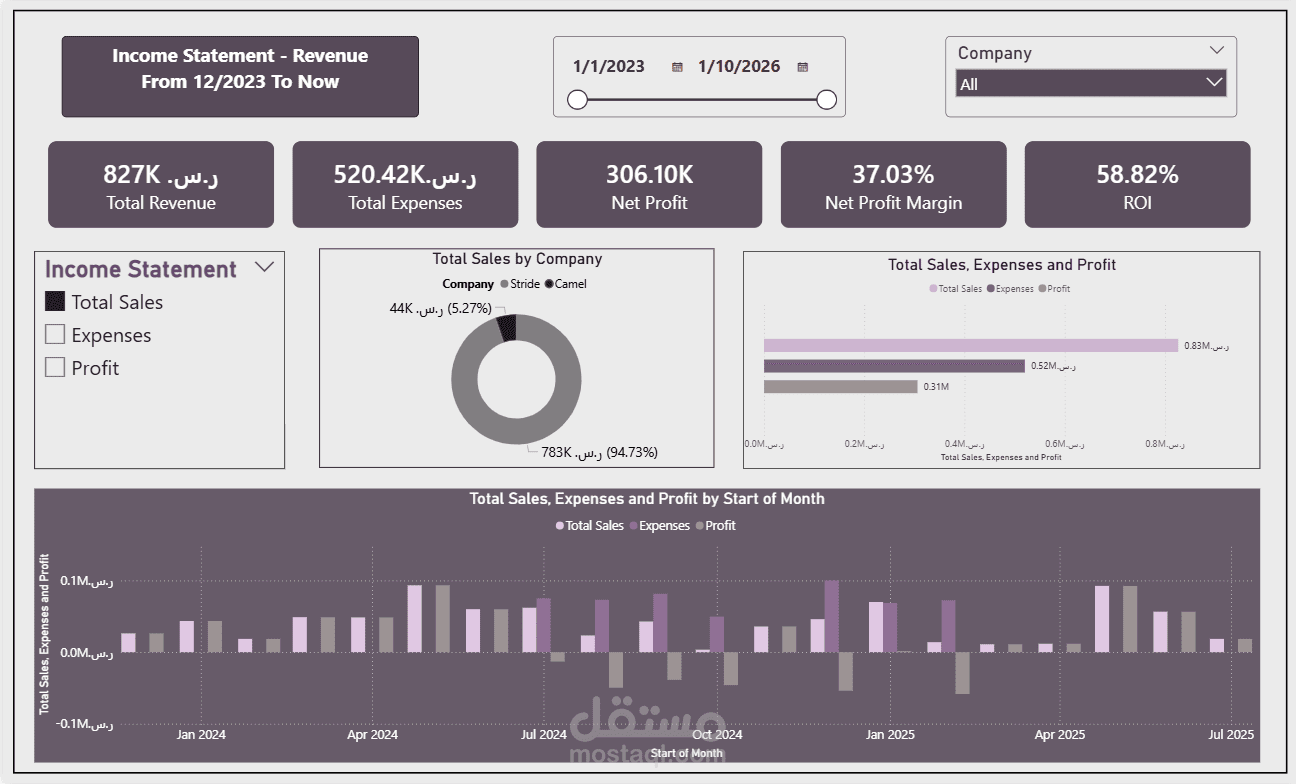
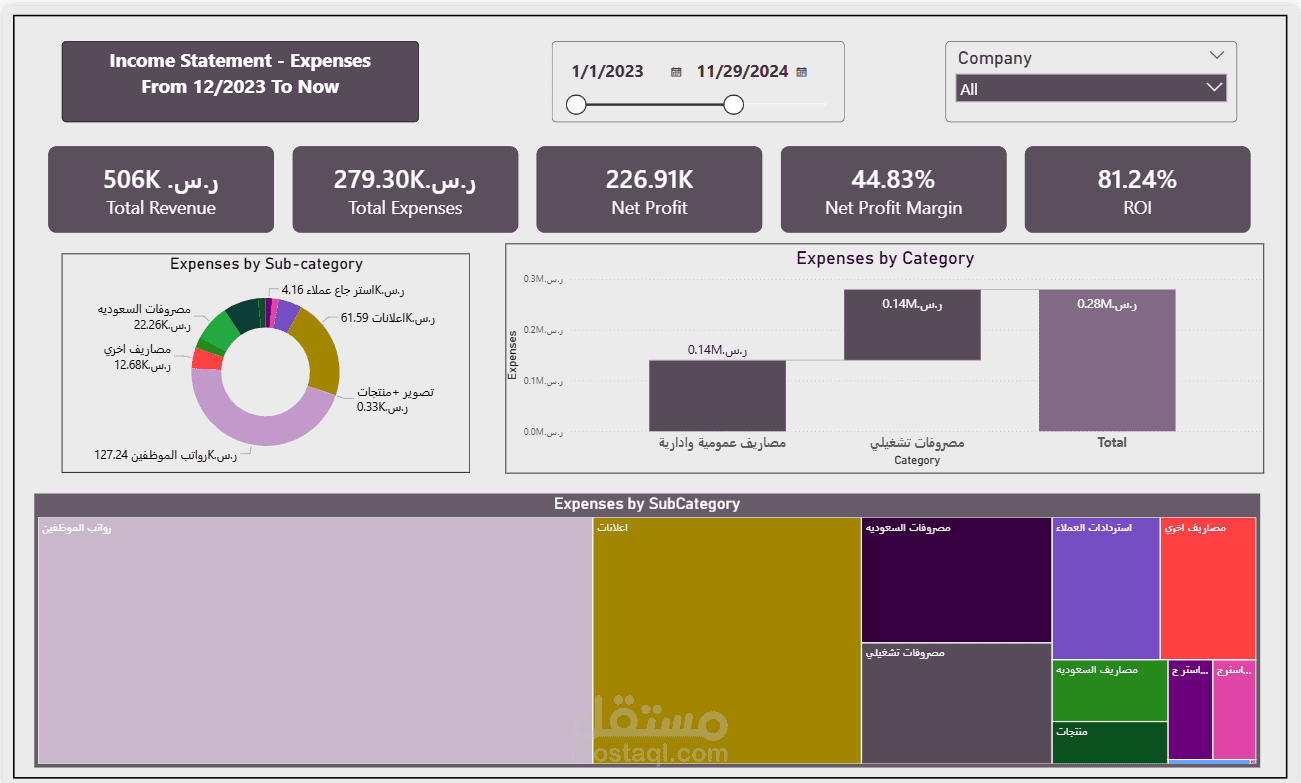
This project focuses on analyzing Sales and Marketing data and building an interactive dashboard using Power BI.
The process started with data collection and cleaning, where raw data was prepared by handling missing values and ensuring consistency. Data transformation was applied to make the dataset ready for analysis.
I created multiple calculated measures using DAX to track key business metrics and performance indicators.
The dashboard consists of three main pages:
1. Sales Performance:
- Includes filters such as company, marketing channel, salesperson, and telesales.
- KPIs include leads, meetings, conversion rates, deals, total sales, and average transaction value.
- Visualizations show sales trends over time, meetings over date, and sales performance by salesperson.
- A matrix view summarizes key metrics such as leads, meetings, deals, and total sales.
2. Income Statement – Revenue:
- Displays financial KPIs such as total revenue, expenses, profit, profit margin, and ROI.
- Includes visual comparisons between revenue, expenses, and profit.
- Shows revenue distribution by company and monthly trends.
3. Income Statement – Expenses:
- Provides a detailed breakdown of expenses by category and sub-category.
- Supports financial analysis through filters by date and company.
Tools Used:
- Power BI
- DAX
Outcome:
The dashboard provides a clear view of sales performance and financial results, helping in tracking KPIs and supporting data-driven decisions.