Accounts and Sectors Analysis Dashboard With Excel
تفاصيل العمل
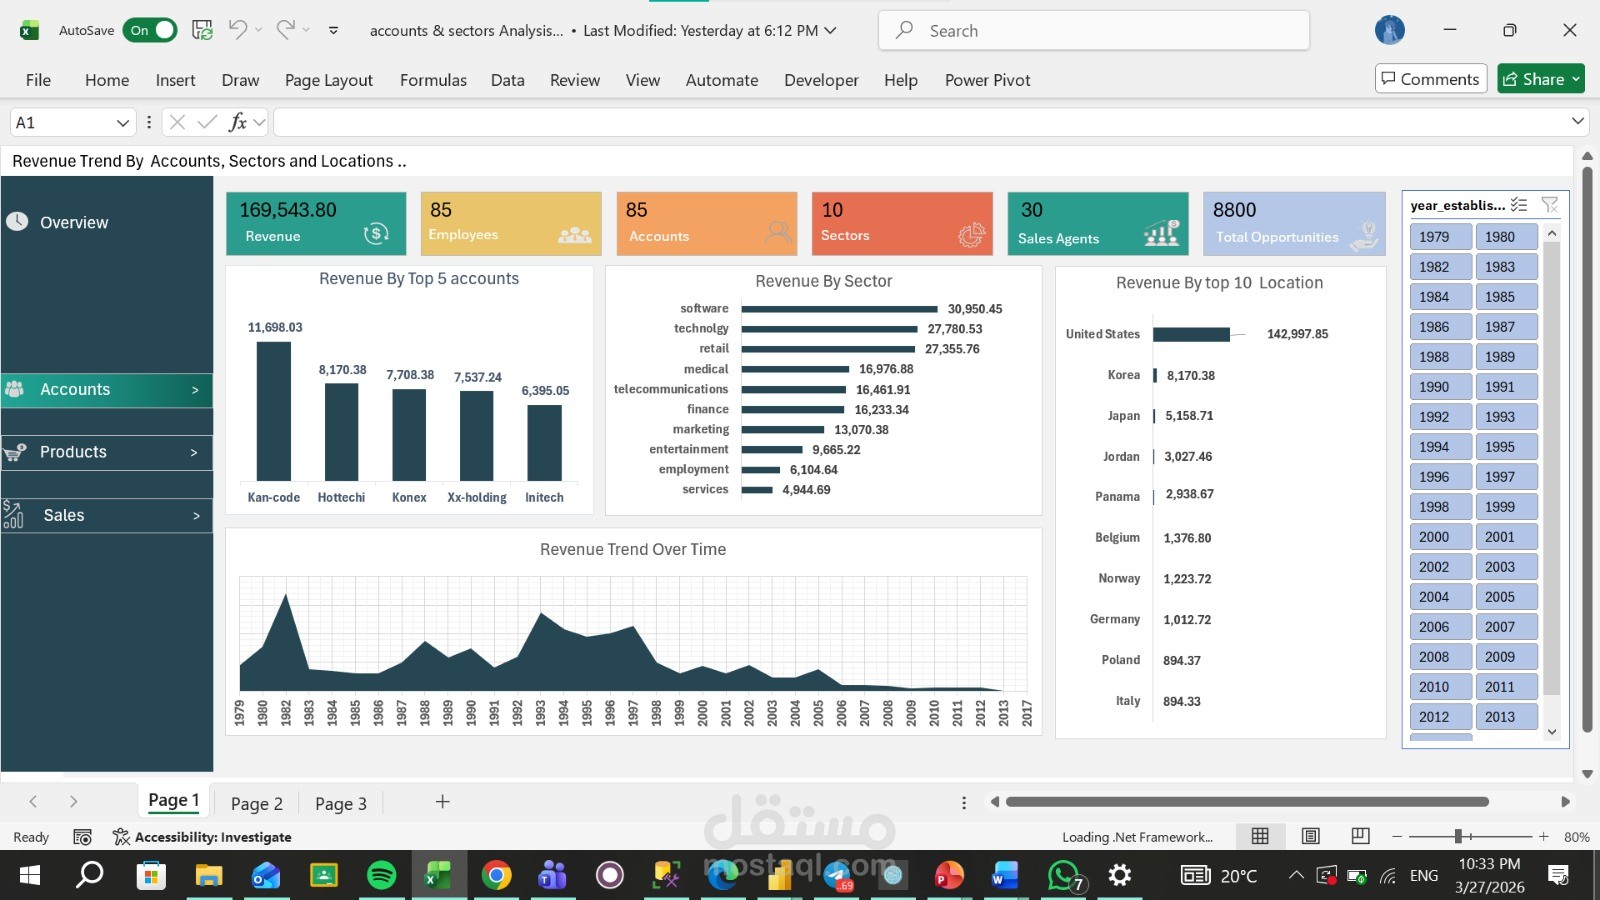

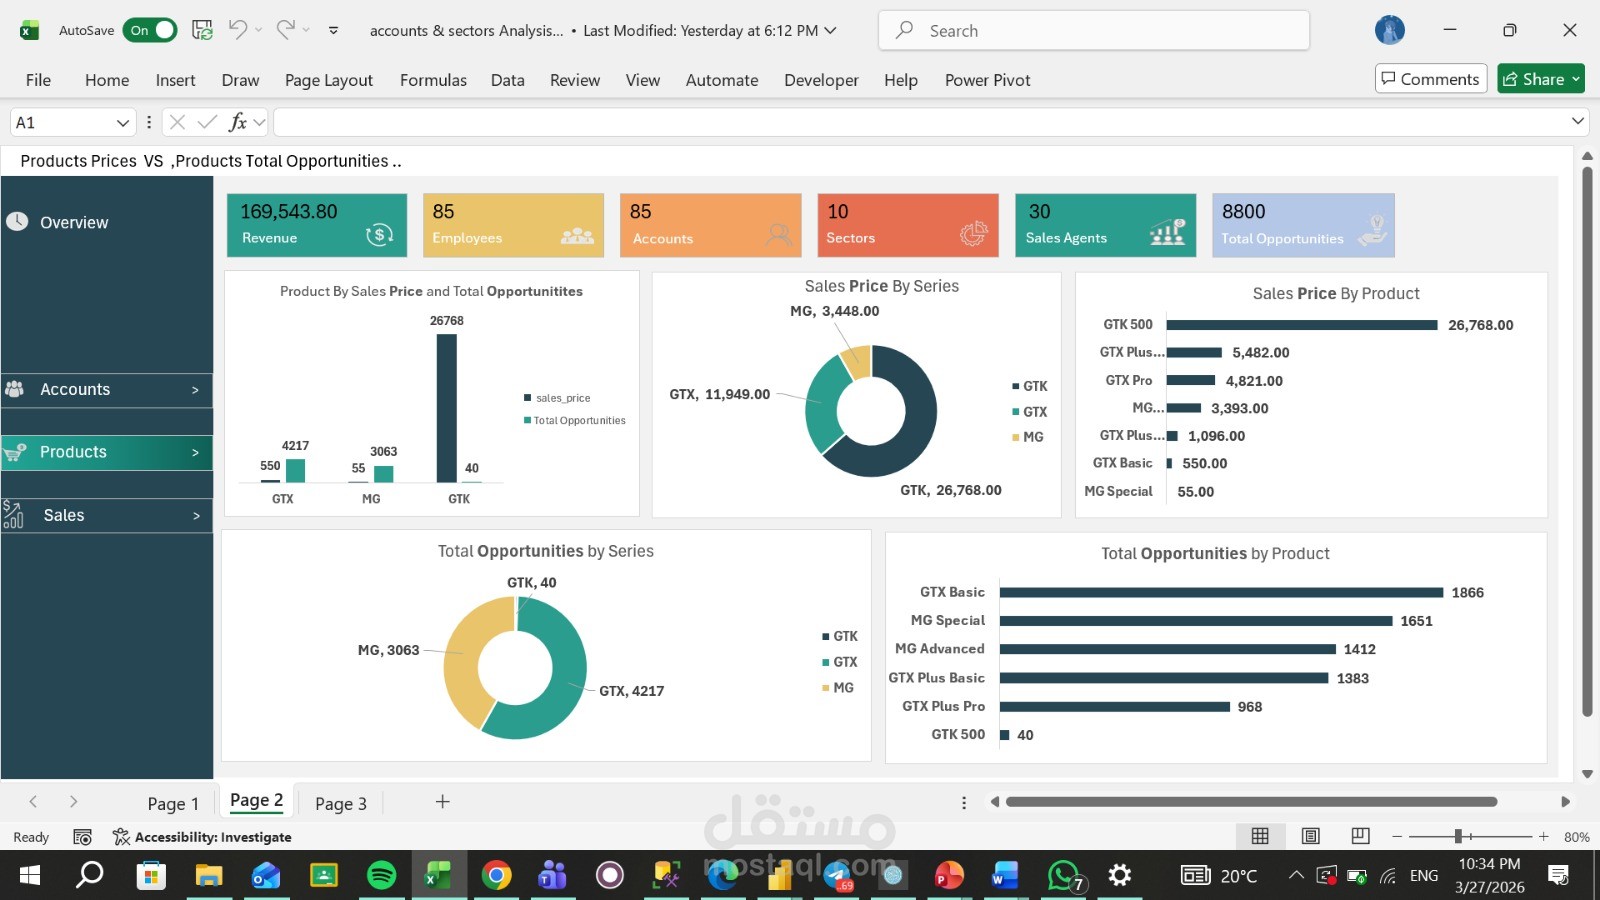
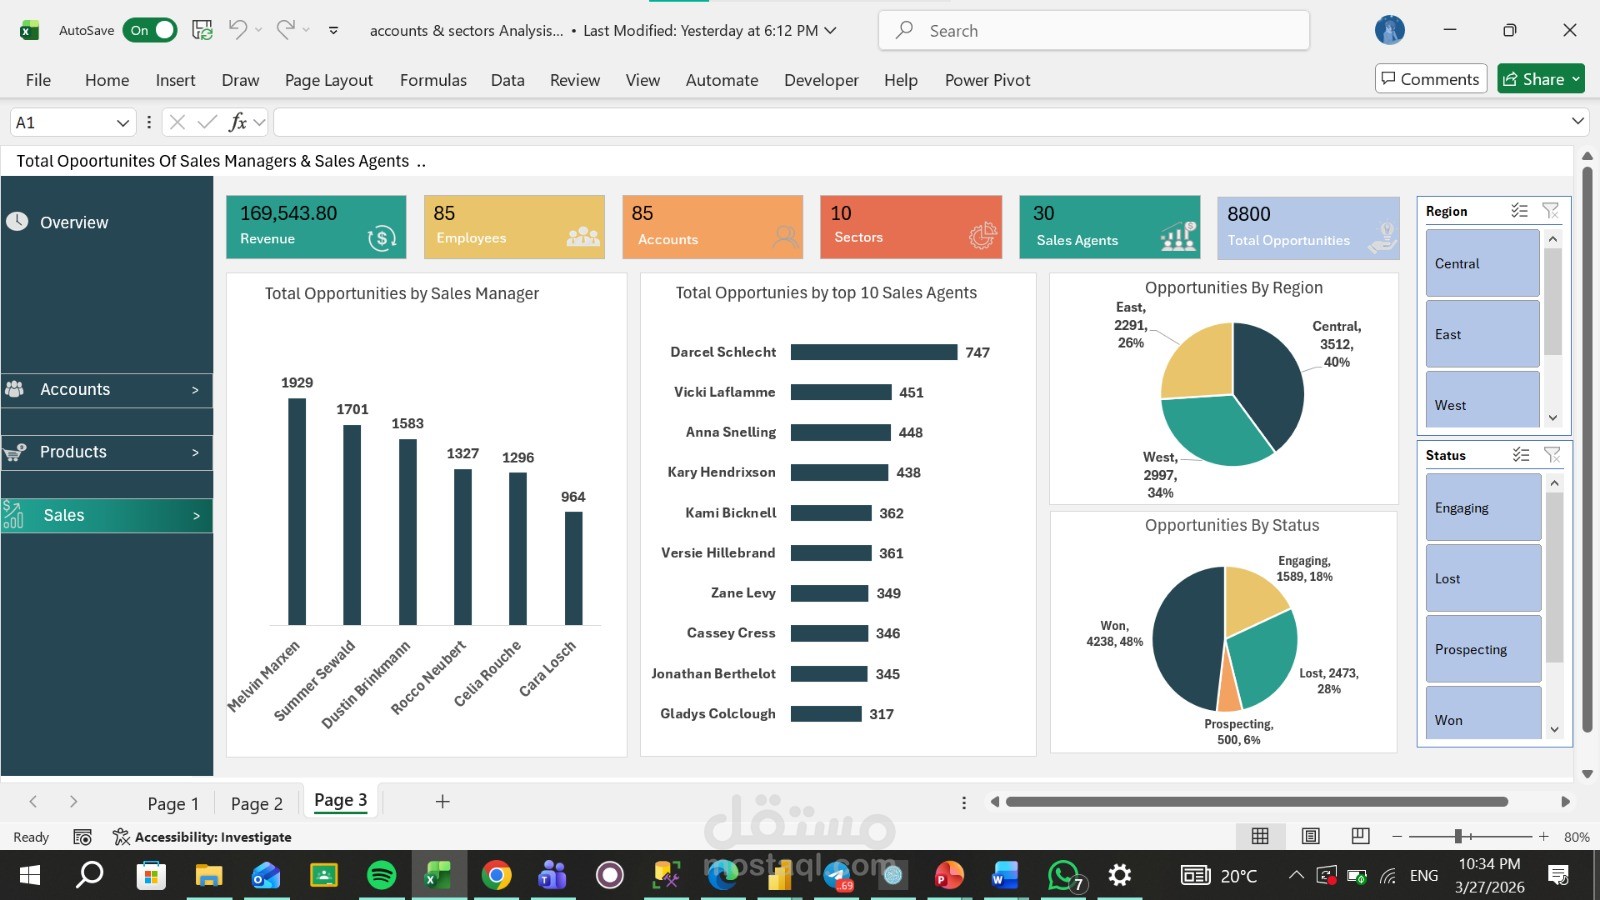
This project is a 3-page interactive Excel dashboard that analyzes company performance across revenue, products, and sales.
What it shows
Revenue trends by accounts and industries, product performance vs pricing, and sales team performance across regions.
Tools & Approach
Built using Excel, Pivot Tables, and Pivot Charts. The data was explored, structured, and transformed to extract meaningful business insights.
Design
Clean, user-friendly layout with visuals chosen to clearly present each insight. Filters are applied only to relevant charts on each page.