Data Analyst / Data Engineer
تفاصيل العمل
Project Overview
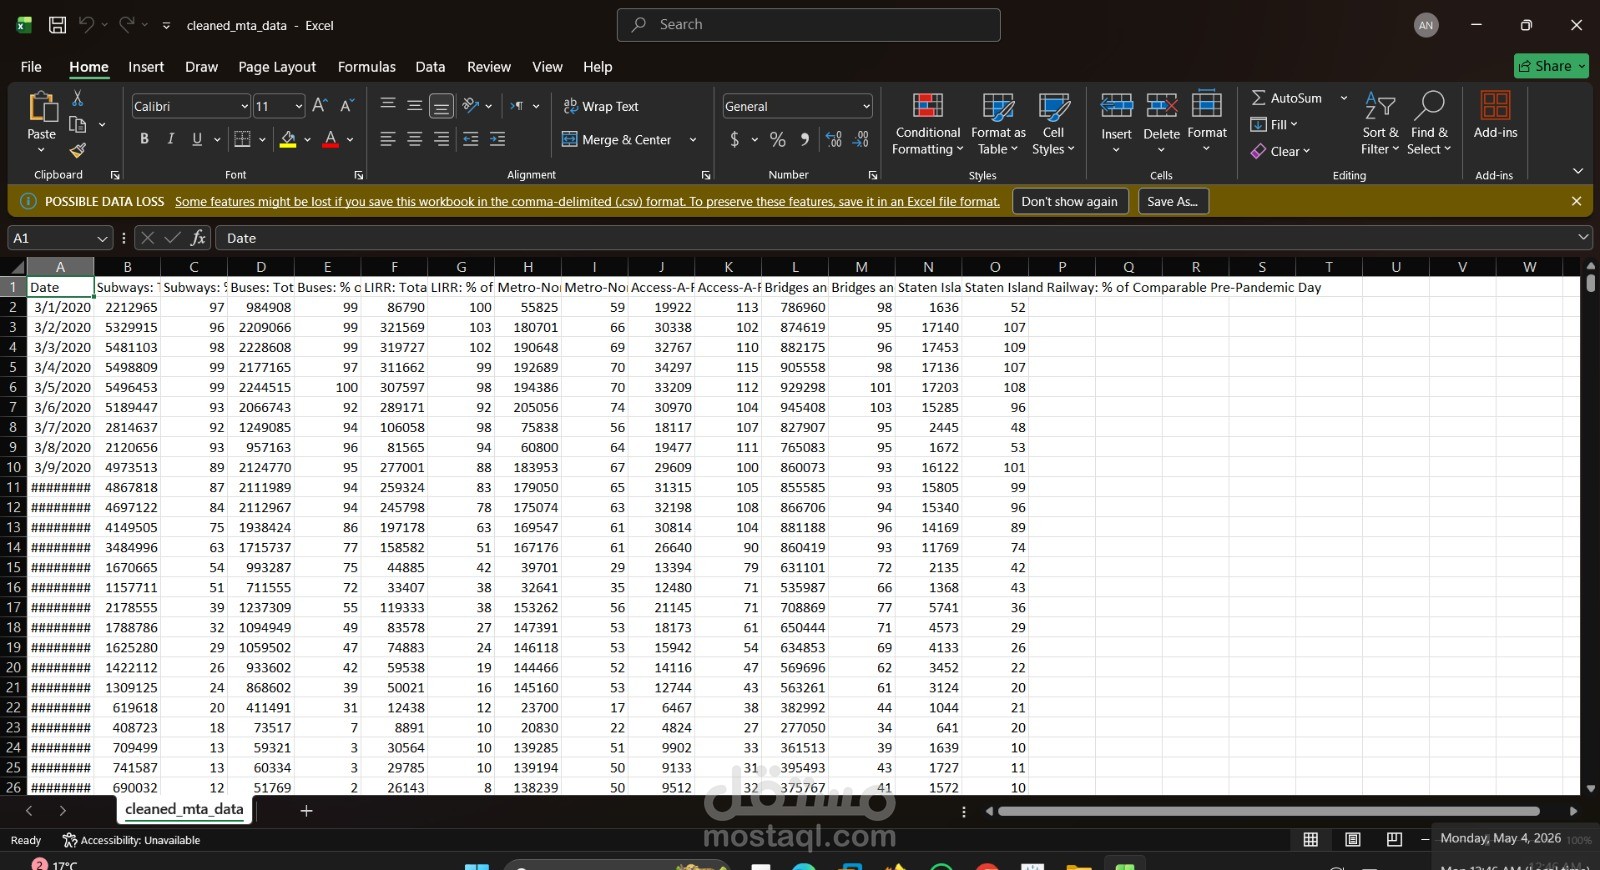
This project involved a comprehensive data cleaning and exploratory analysis of the Metropolitan Transportation Authority (MTA) ridership data. The primary goal was to process raw transportation metrics to track the recovery of New York City's transit systems following global shifts in commuting patterns. The analysis is based on the dataset: "cleaned_mta_data مستقل.csv".
Key Objectives
Data Refinement: Cleaning and structuring raw MTA records into the "cleaned_mta_data مستقل.csv" file to ensure accuracy in date formatting and numerical consistency.
Multimodal Analysis: Comparative study of ridership across various modes including Subways, Buses, LIRR, Metro-North, and Staten Island Railway.
Recovery Benchmarking: Analyzing the "% of Comparable Pre-Pandemic Day" metric to identify which sectors recovered fastest and where demand remains shifted.
Traffic Insights: Monitoring bridge and tunnel traffic alongside public transit to evaluate the balance between private vehicle usage and public transport.
Technical Highlights
Dataset Scale: Managed over 1,700 daily records spanning from March 2020 through recent periods.
Metrics Tracked: Total estimated ridership, scheduled trips for Access-A-Ride, and traffic volume for bridges and tunnels.
Tools Used: Python (Pandas for data manipulation, Matplotlib/Seaborn for visualization).
Core Outcomes
The processed data in "cleaned_mta_data مستقل.csv" provides a clear, quantitative look at NYC’s urban mobility. It serves as a foundation for predictive modeling or urban planning dashboards, highlighting the resilience of the city's infrastructure and changing passenger behaviors.