داشبورد
تفاصيل العمل
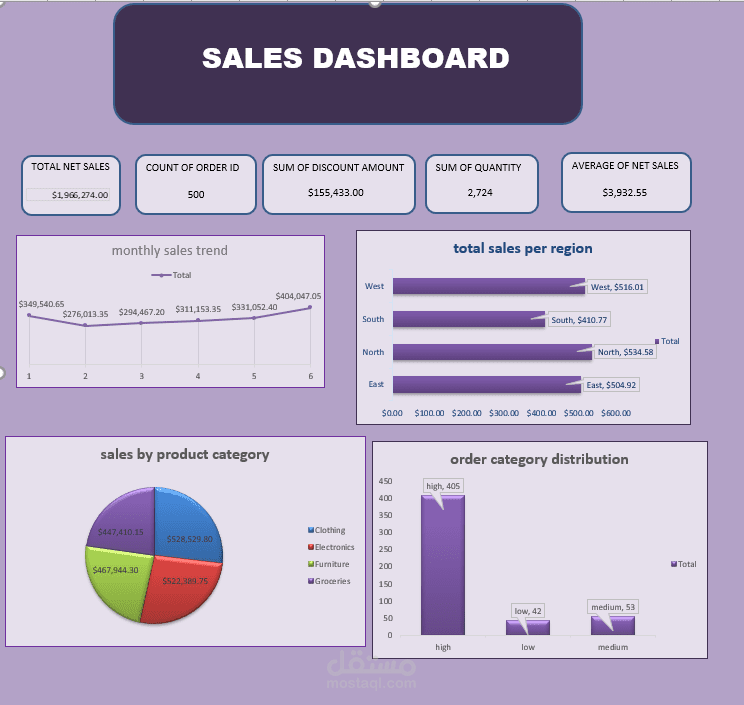
my first Dashboard project in data analysis field
.firstly KPI have
-total sales of data
- count of order id
-sum of discount amount
-total quantity sold
.secondly charts
-monthly sales trend: explain total sales in each month
-total sales per region :identify total sales in each region
-sales by product category : profit of each category
-order category distribution : order value segmentation (high ,medium ,low)
this project helps me to improve my skills in visualization