car sales dashboard
تفاصيل العمل
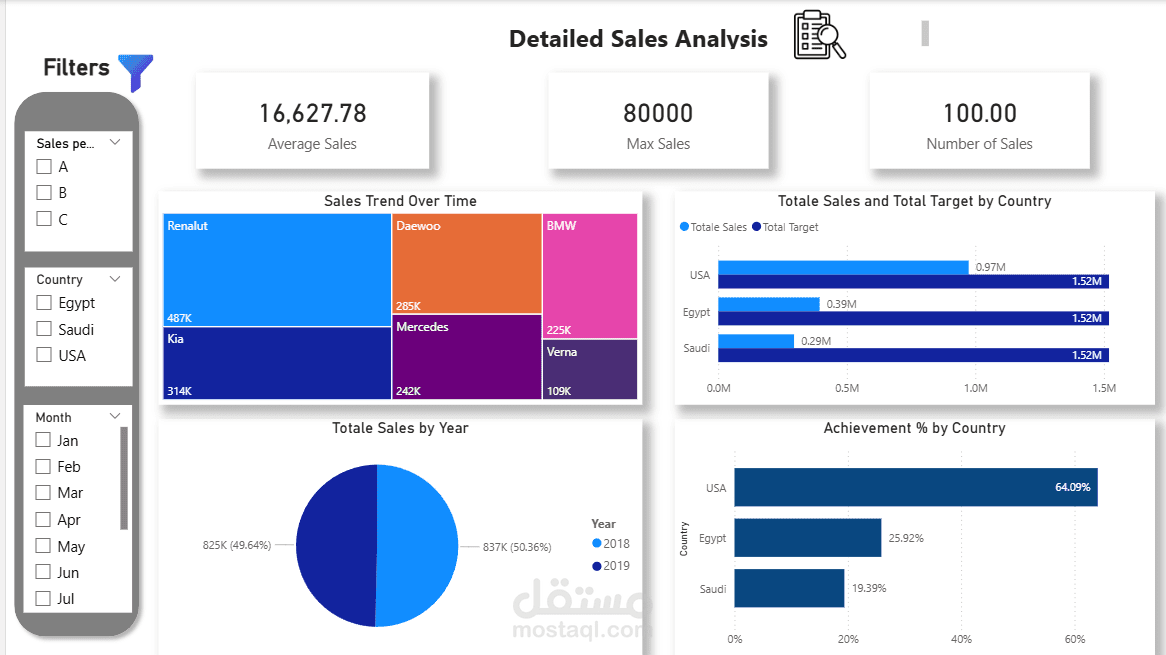
This project is a comprehensive Car Sales Dashboard developed using Power BI to analyze and visualize sales performance across different dimensions.
The dashboard provides clear insights into total sales, targets, and achievement percentage, helping track business performance effectively. It includes interactive filters such as country, car brand, and year to allow dynamic data exploration.
Key features of the dashboard:
- Sales trend analysis over time
- Total sales comparison by country
- Performance analysis by sales representatives
- Car brand performance insights
- Detailed breakdown of sales and targets
The goal of this project is to transform raw sales data into meaningful visual insights that support better decision-making and business growth.
Tools used: Power BI, Data Cleaning, Data Visualization