Bank Analytics Platform
تفاصيل العمل
Project Overview
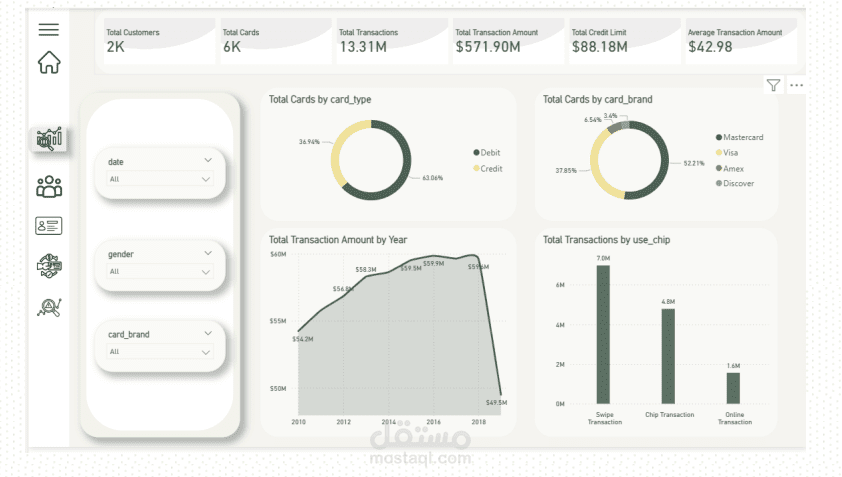
Developed a comprehensive and interactive Power BI dashboard to analyze credit card transaction data and generate actionable business insights. The project focuses on transforming raw data into meaningful visualizations that support strategic decision-making and enhance understanding of customer behavior and financial performance.
Key Features
Built dynamic KPIs including Total Customers, Total Cards, Total Transactions, and Total Transaction Amount
Performed customer and transaction segmentation based on card type and brand
Conducted trend analysis to identify patterns and changes in transaction amounts over time
Analyzed transaction methods (Swipe, Chip, Online) to uncover usage behavior
Designed interactive filters enabling deep data exploration (date, gender, card attributes)
Applied clean and user-friendly dashboard design principles to improve data storytelling and usability
Implementation Approach
Performed data cleaning, transformation, and preparation to ensure data quality
Designed and implemented a data model within Power BI
Created calculated measures and KPIs using DAX for advanced analytics
Developed interactive visualizations and dashboards aligned with business requirements
Applied data storytelling techniques to present insights in a clear and impactful way
Validated outputs and ensured accuracy of analysis to support data-driven decisions
Tools & Technologies
Power BI | DAX | Data Modeling | Data Visualization | Data Analysis