Sales Analysis Dashboard in Excel with KPIs & Charts
تفاصيل العمل
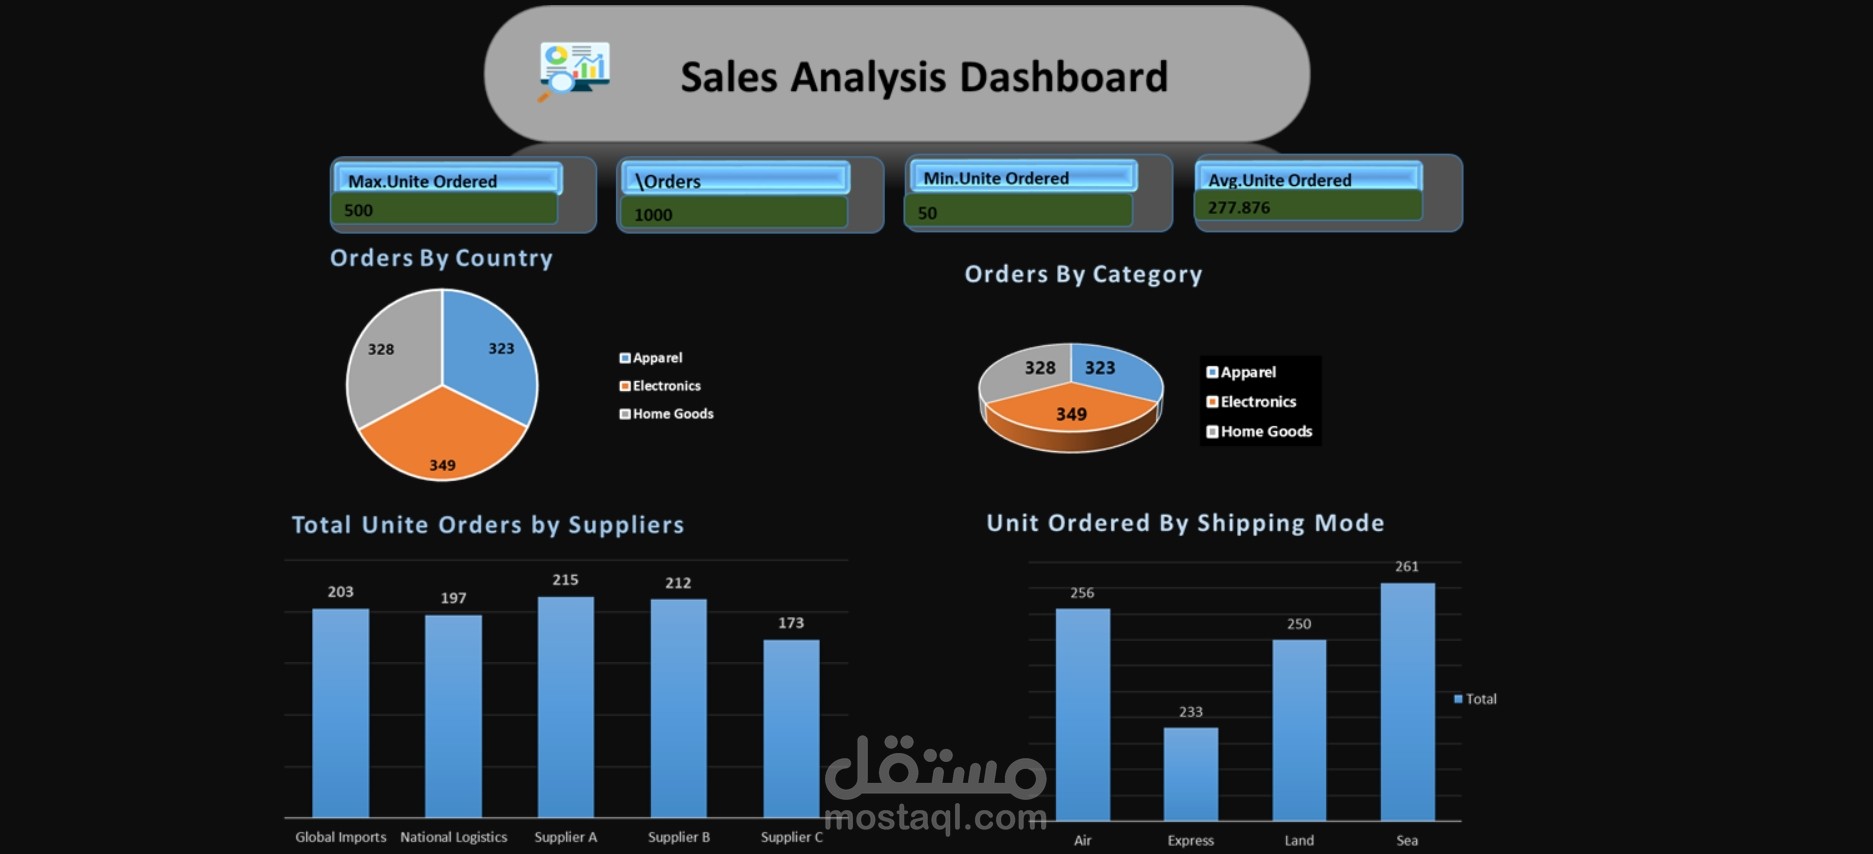

Created a Sales Analysis Dashboard in Excel using PivotTables. The dashboard includes KPIs (Total Orders, Max Unit Ordered, Avg Unit Ordered, Min Unit Ordered) and visual charts to track performance:
• Bar chart: Total units ordered by suppliers
• Pie chart: Orders by country
• Bar chart: Units ordered by shipping mode
• Pie chart: Orders by category
This dashboard provides a clear, interactive view of supply chain performance for quick decision-making.