customer behavior dashboard using excel
تفاصيل العمل
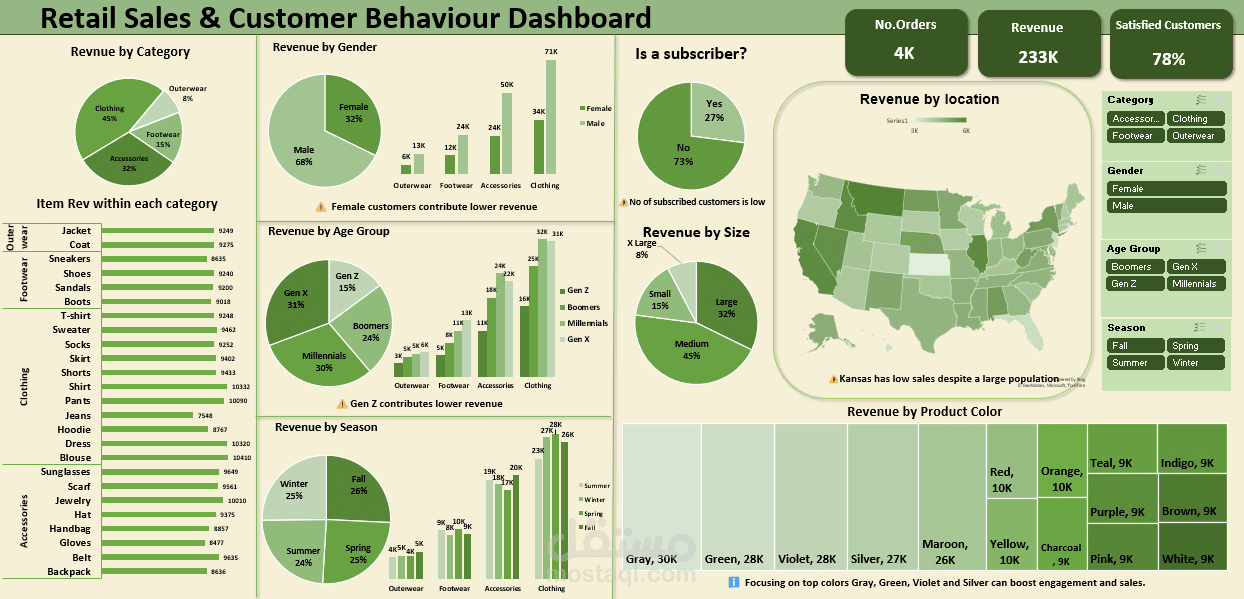
i had a goal of analyzing customer behavior in a super store in the united states, evaluating purchases and satisfaction by age group, gender, state,etc..
i worked on raw data that had some issues like missing values, i treated these issues. Then i started the data modeling part and connected relationships between tables. After that, i have developed the pivot tables and charts then integrated then into one interactive dashboard that showed the KPIs which was the customer behavior, customer satisfaction and revenue.