Sales Data Analysis Dashboard
تفاصيل العمل

Analysis of Sales Data + Interactive Dashboard
Excel was used to analyze real-world sales data in order to derive useful insights for improved decision-making.
What was carried out:
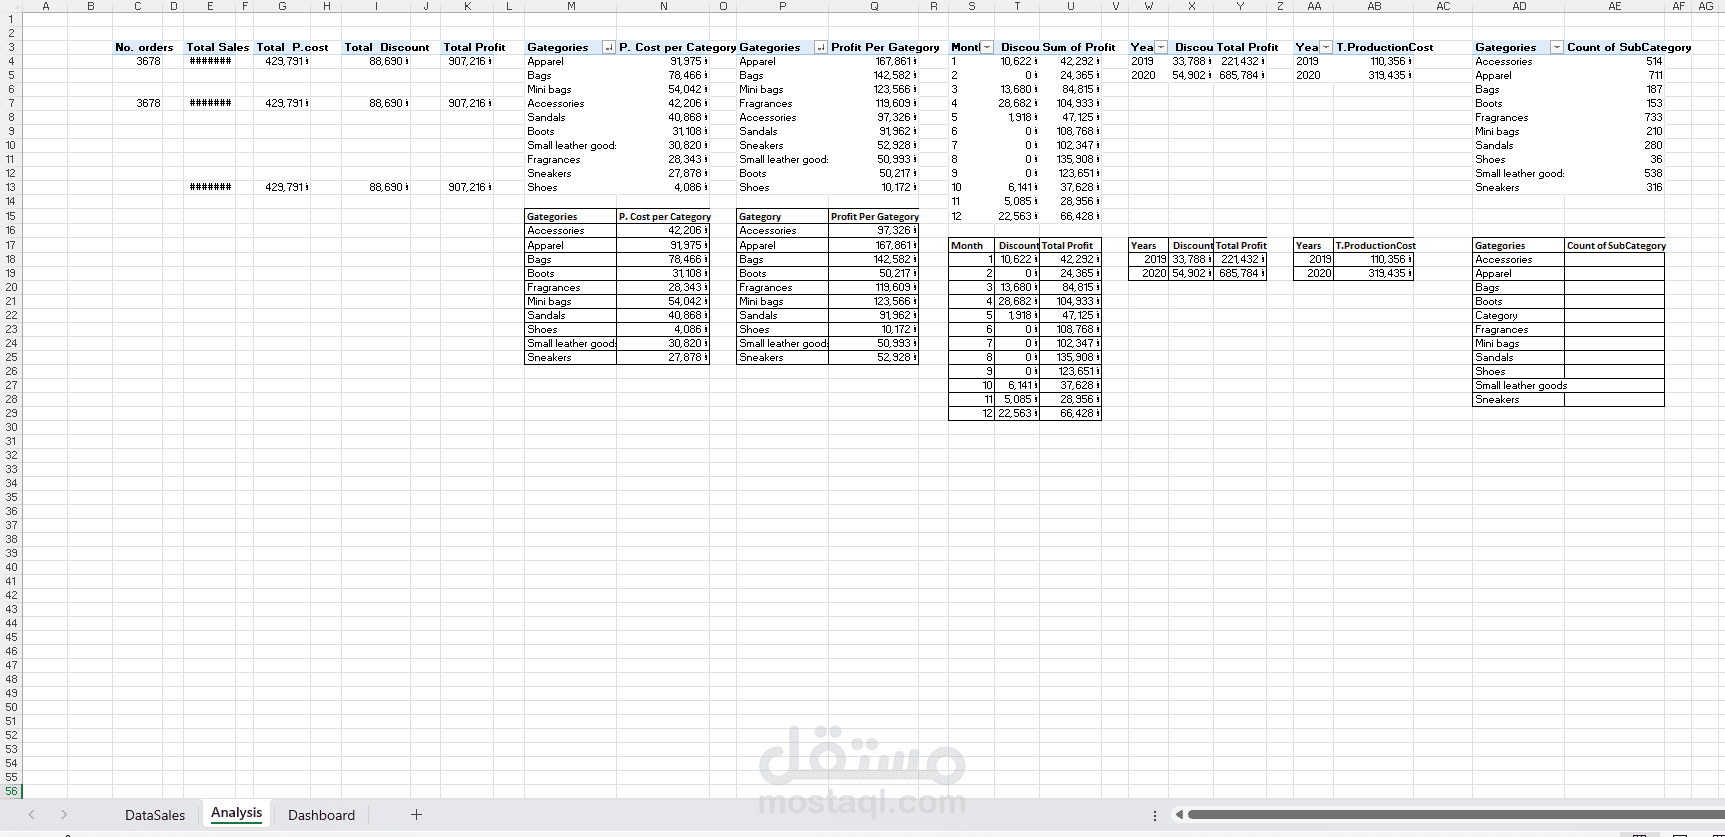
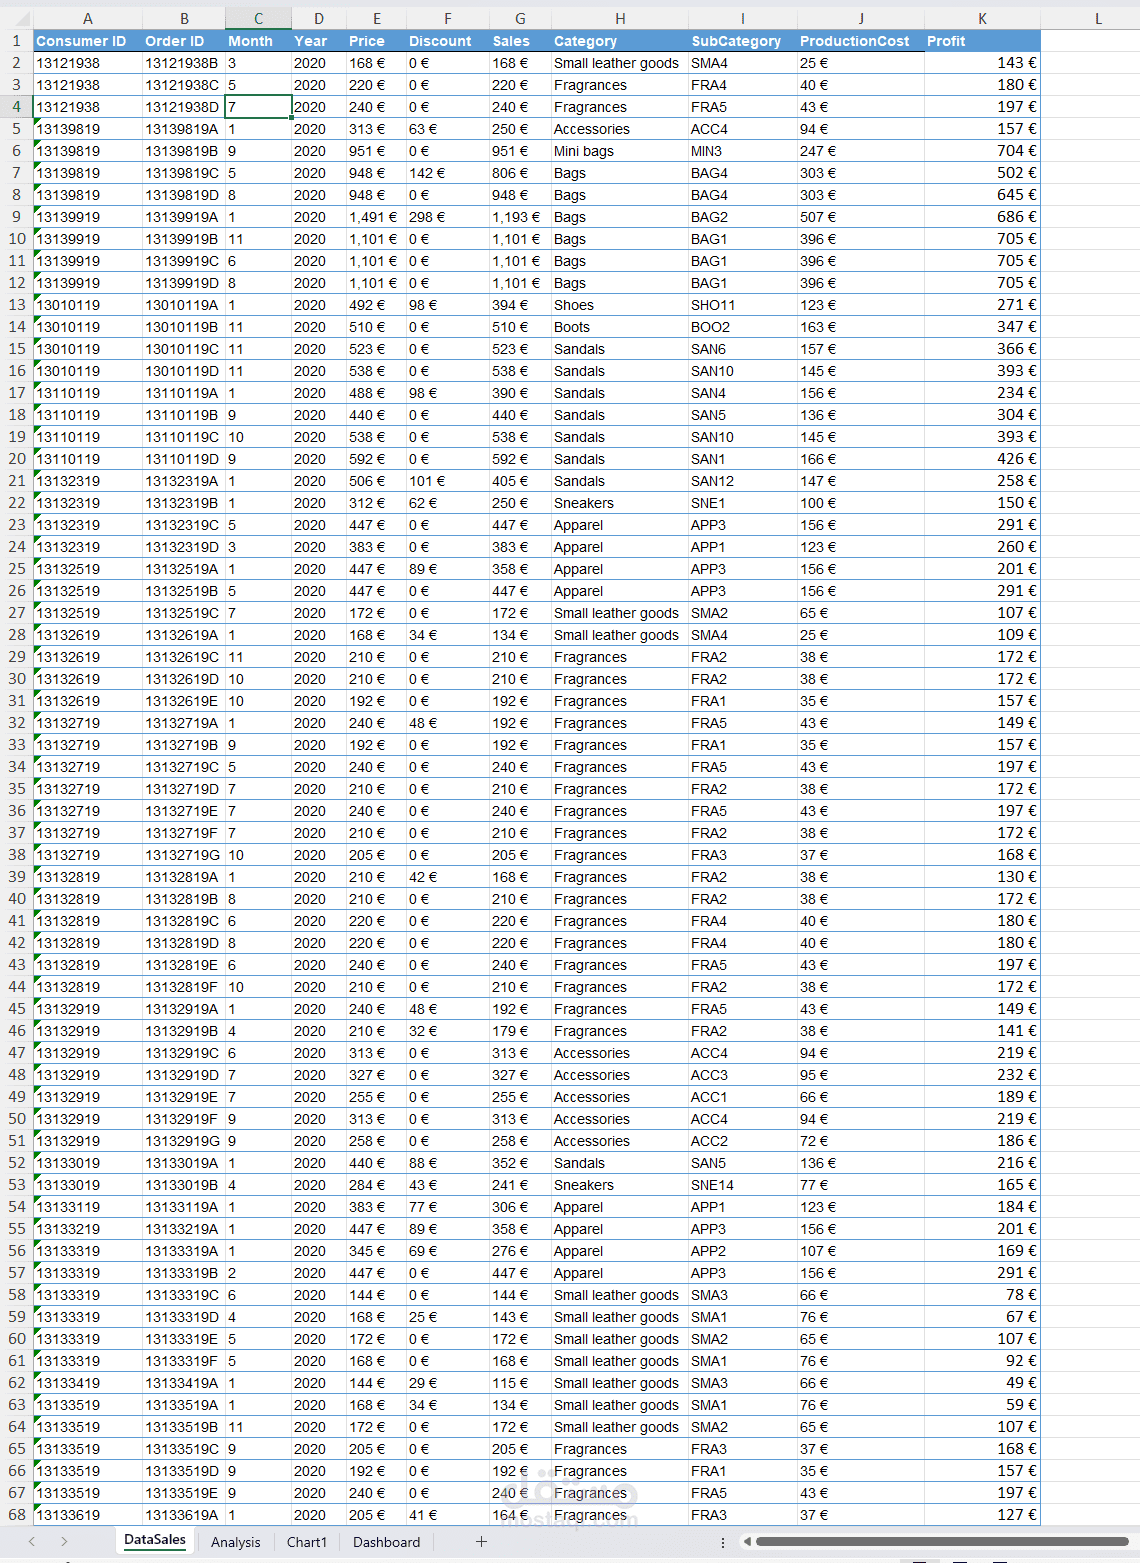
Data was cleaned and transformed with Power Query
examined more than 1,900 sales transactions
examined production costs, sales, and discounts.
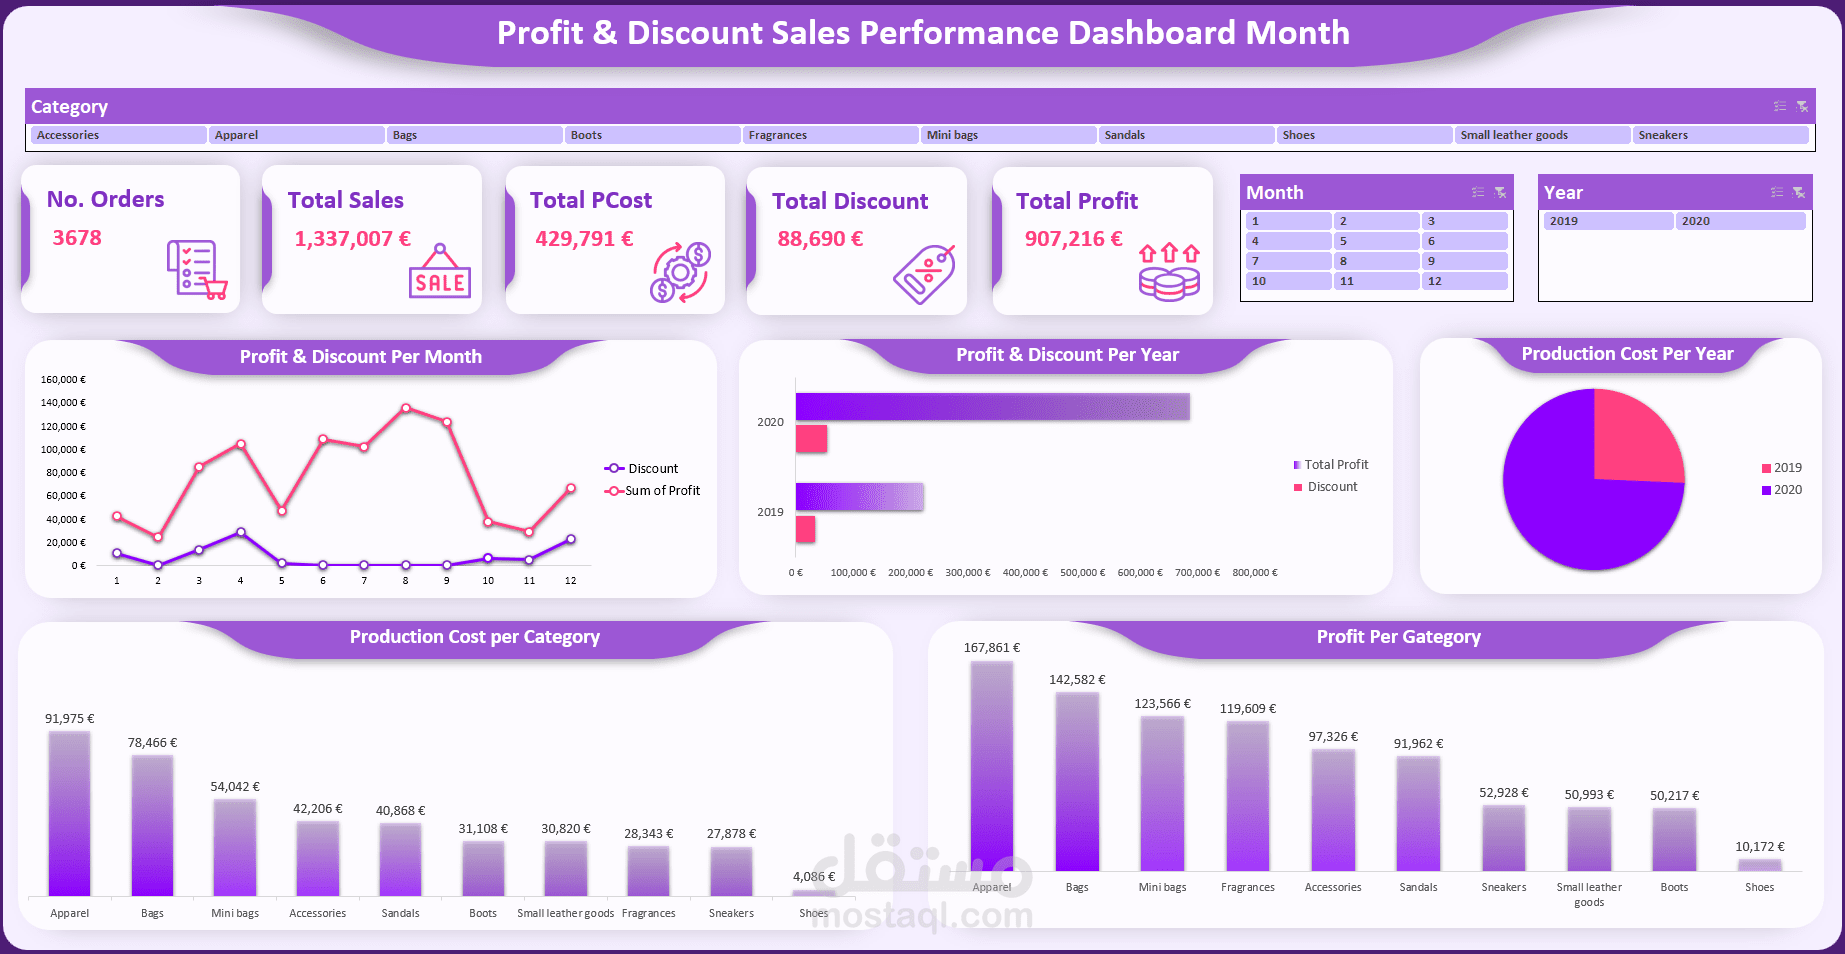
conducted trend analysis on a monthly and annual basis.
determined the best goods and categories
Important Takeaways:
identified the primary sources of profit
assessed the effect of the discount on revenue
highlighted the top-performing categories
Clearly visualized trends
Features:
Dashboard with interaction
Data visualization and KPI tracking
Tools: Data analysis, pivot tables, Excel, and Power Query