Global Sales & Performance Dashboard
تفاصيل العمل
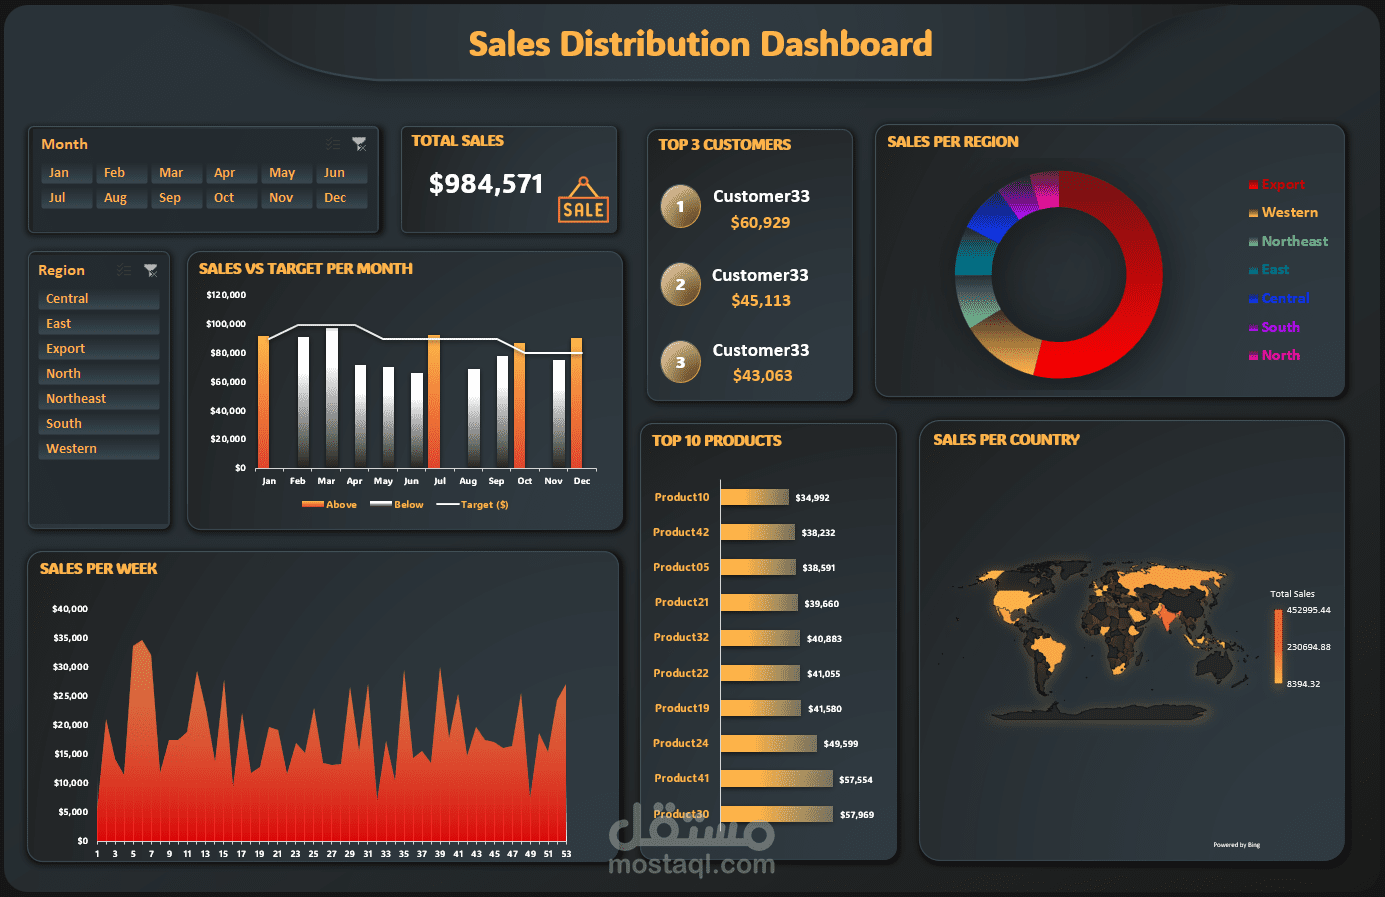
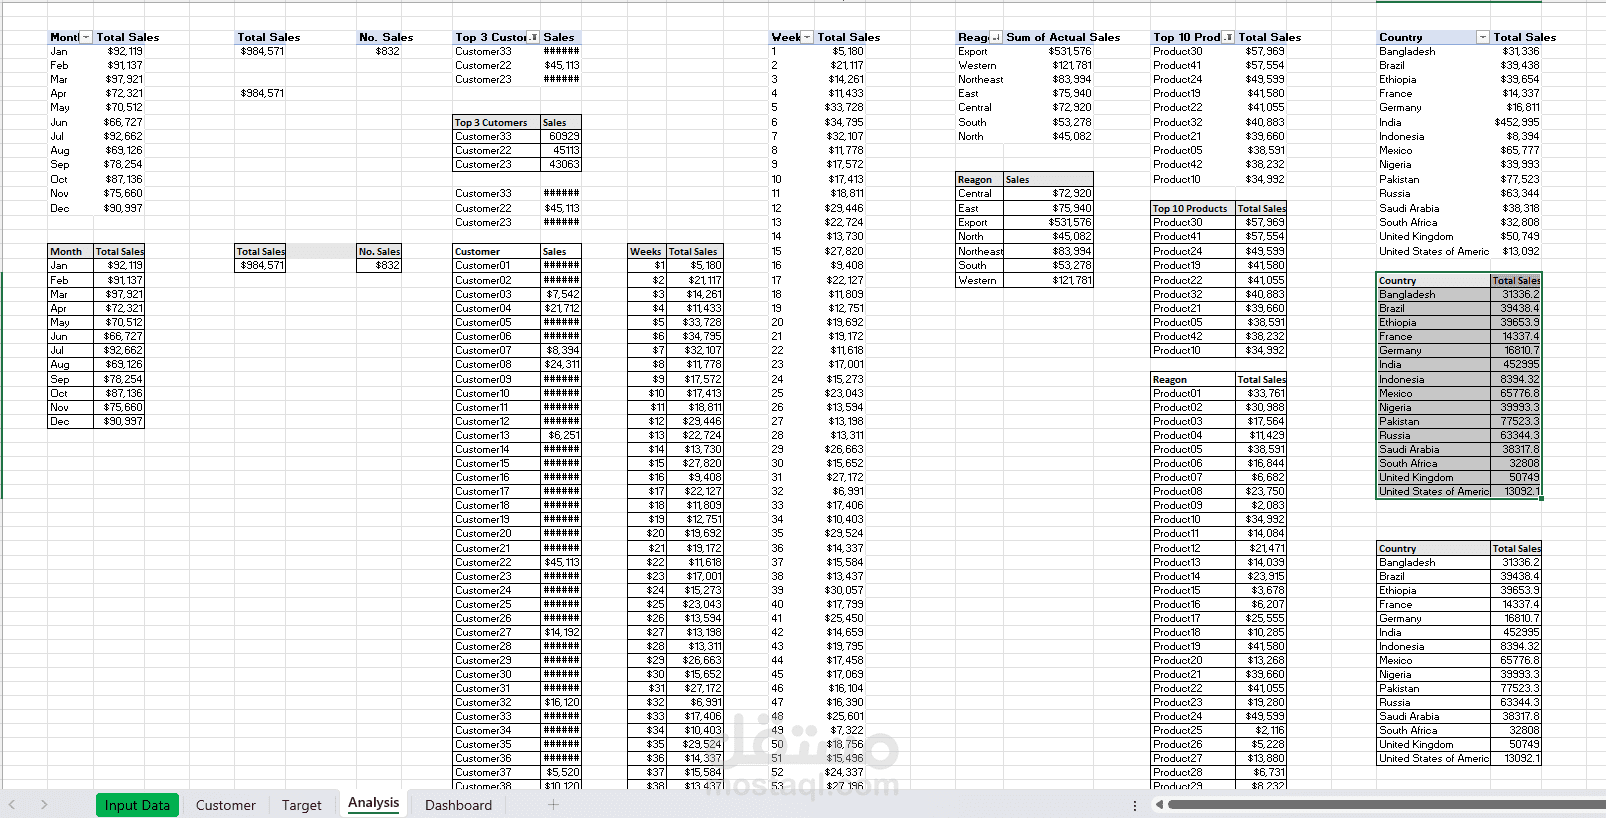
Dashboard for Global Sales and Performance
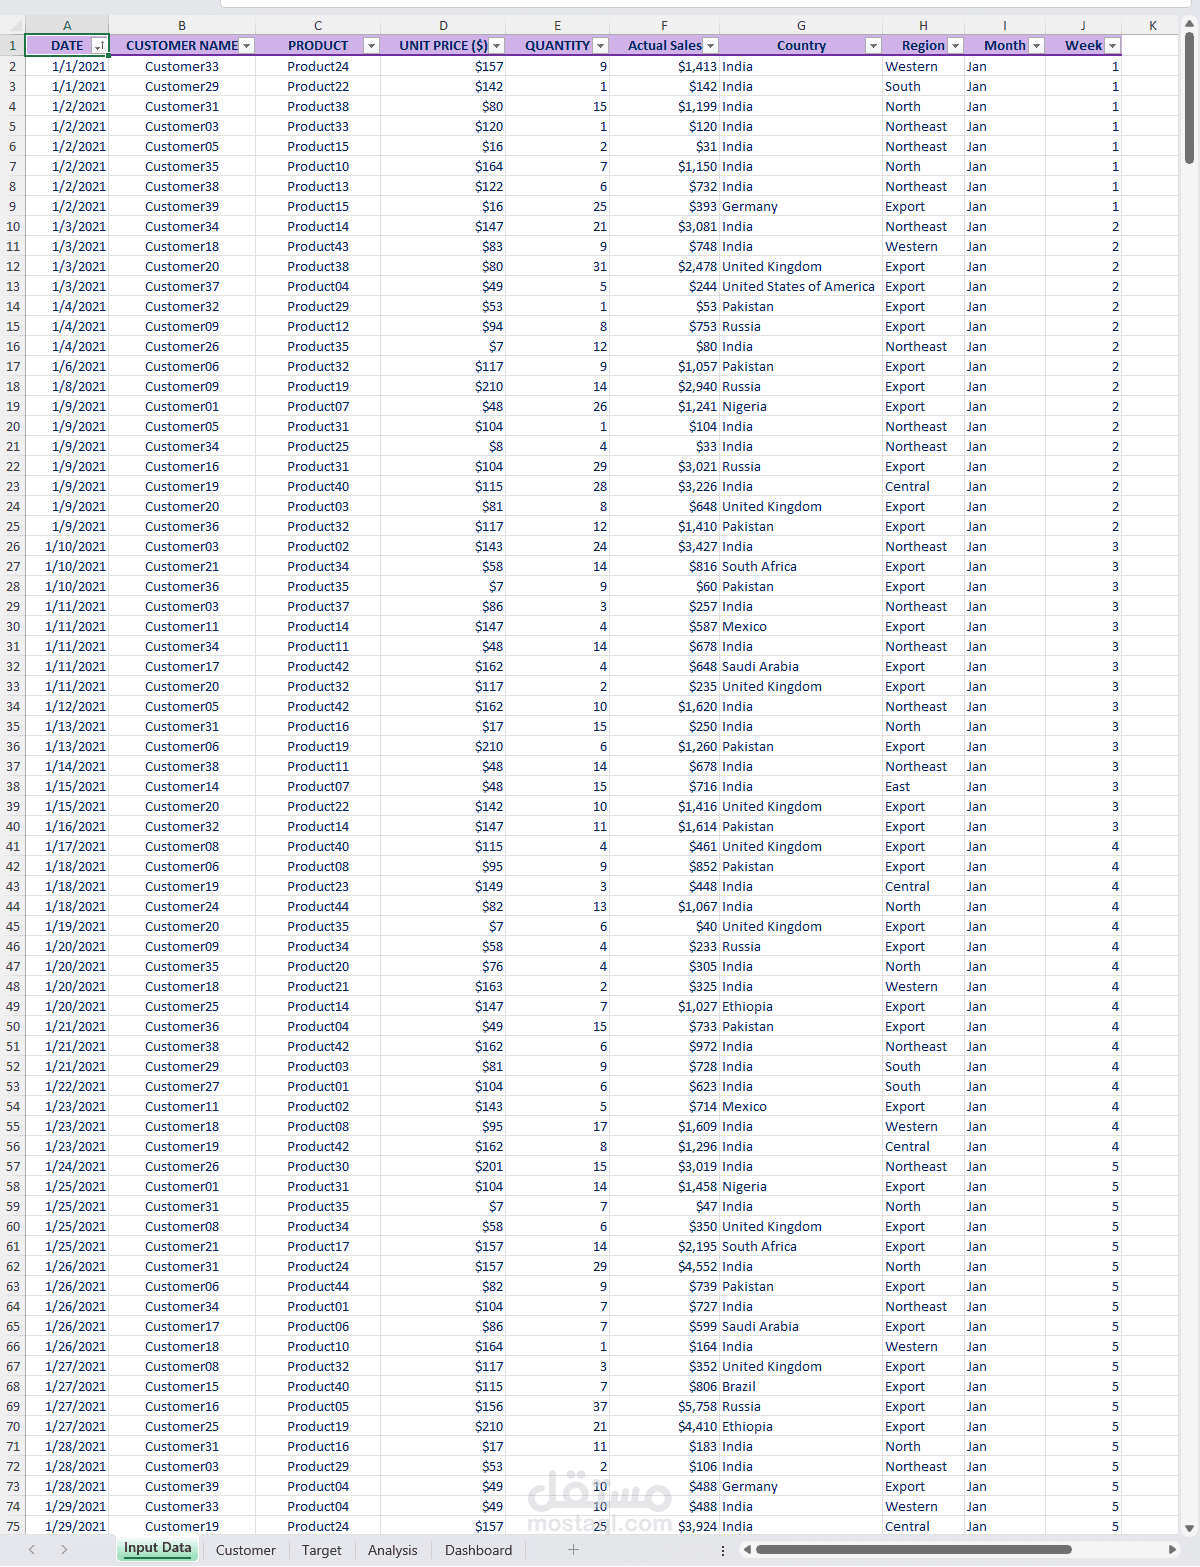
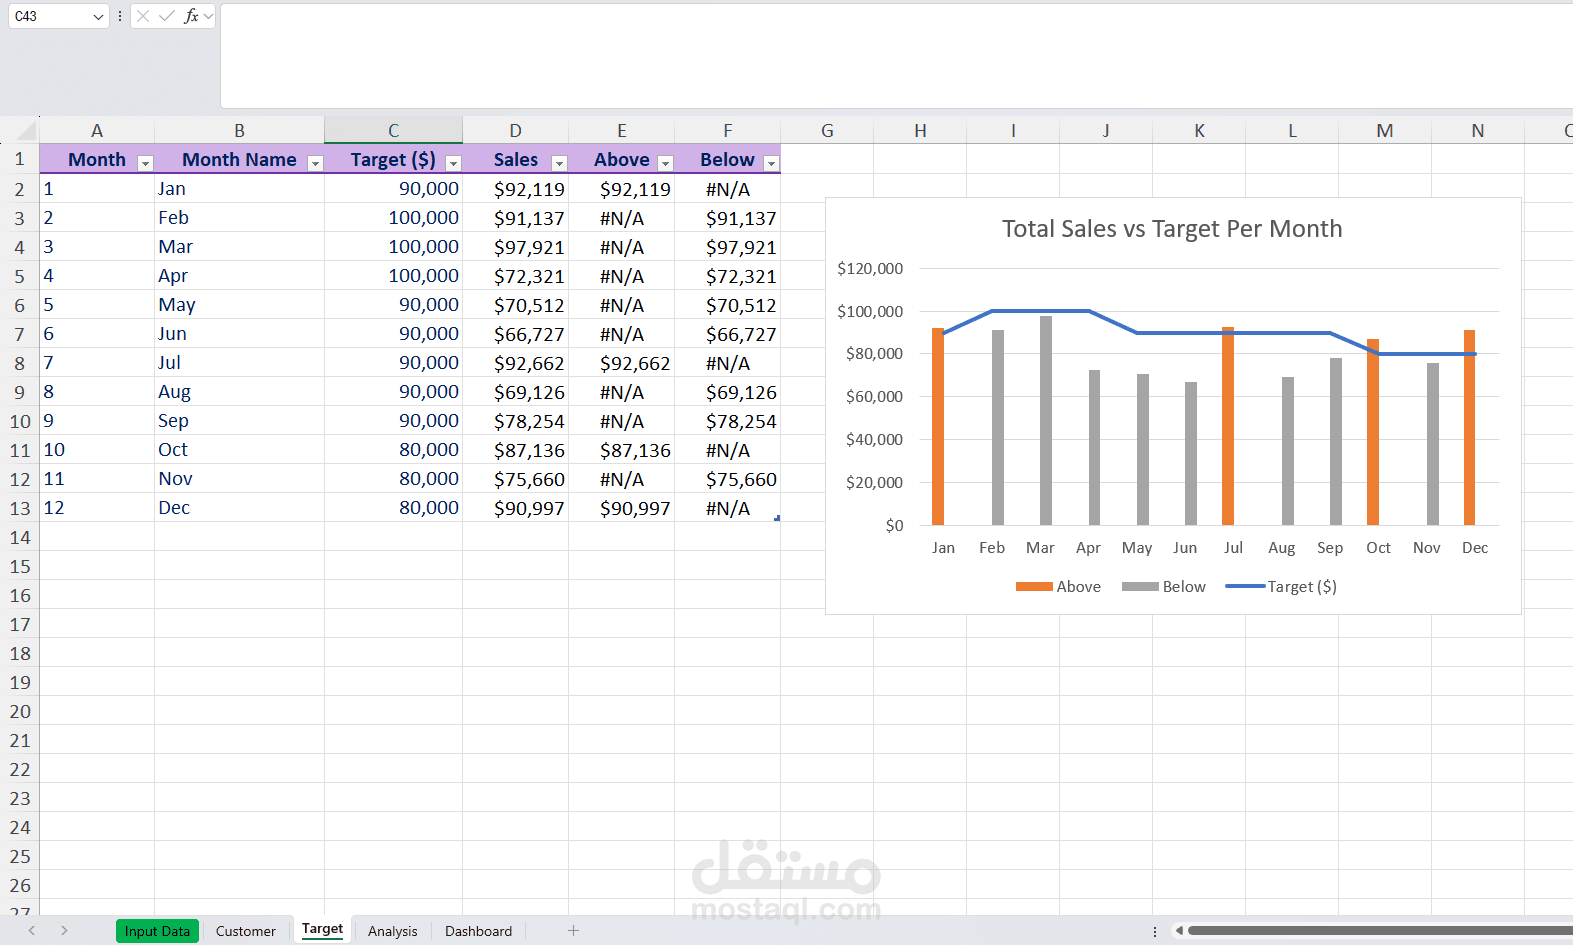
Analyzed more than $980K in sales data to assess company performance and monitor revenue trends in relation to goals.
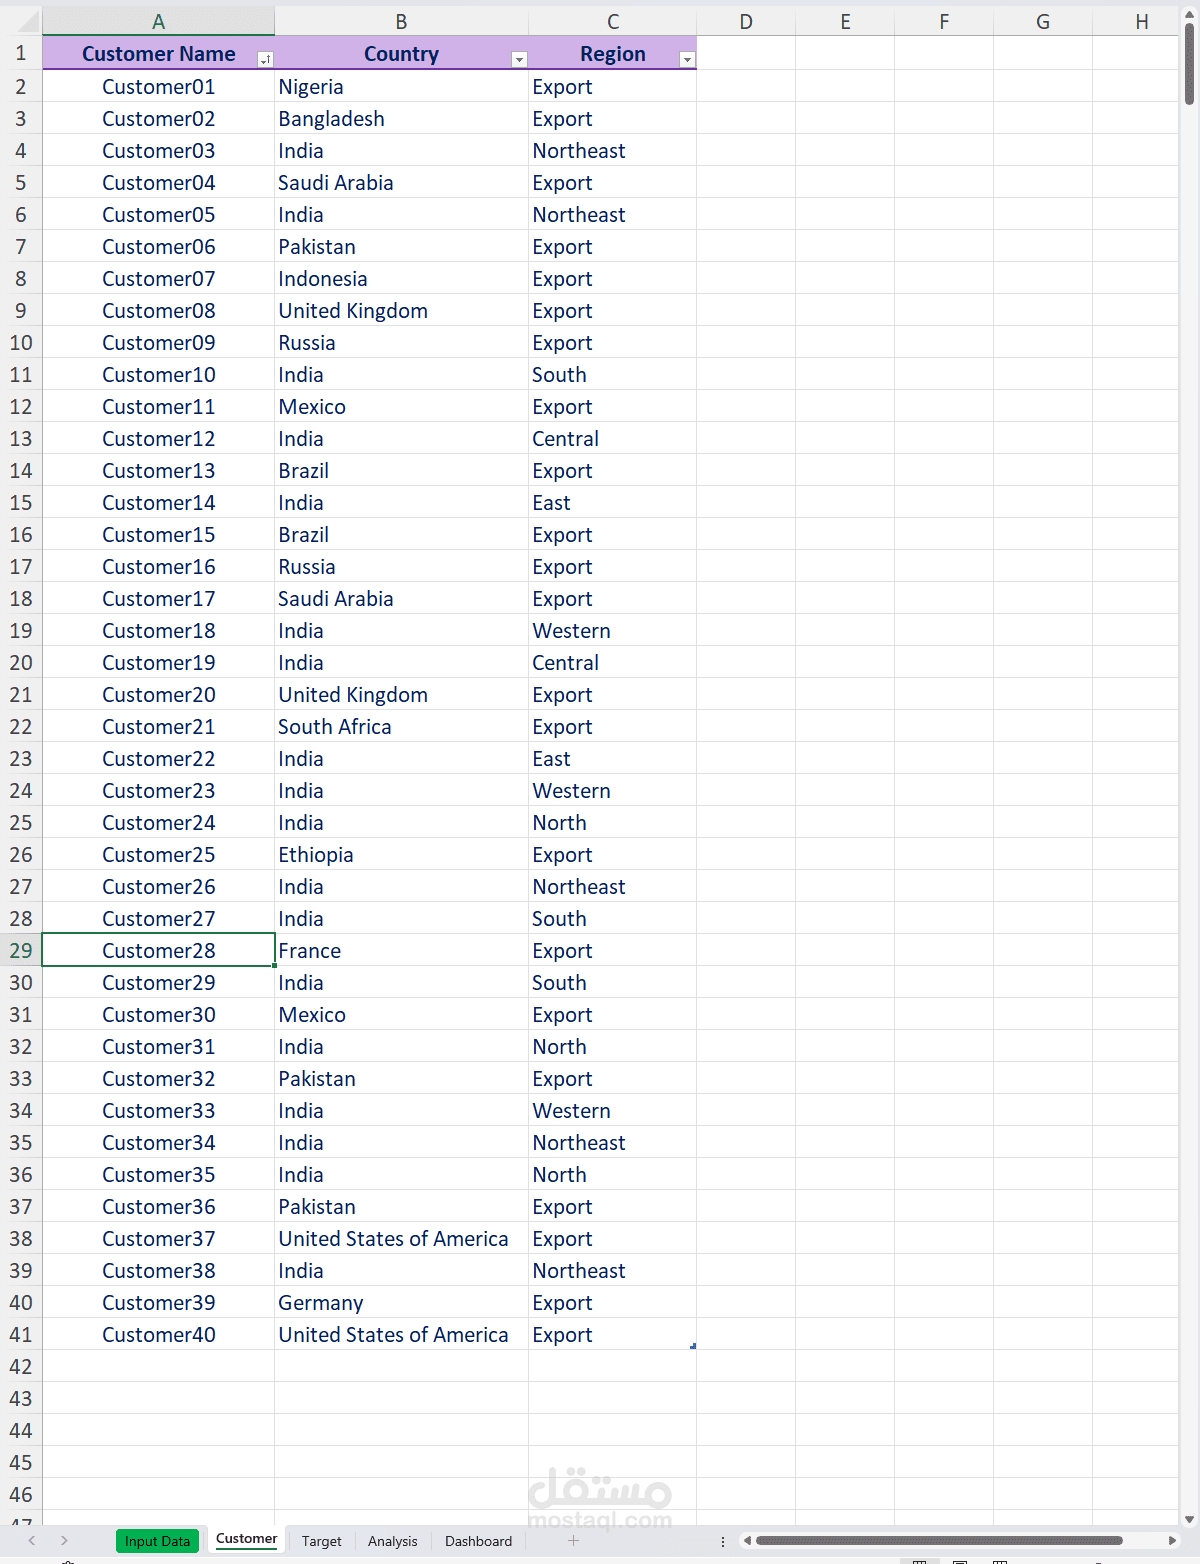
created dynamic dashboards to compare customer segments, regional sales (domestic vs. export), and monthly performance.
found high-value clients and top-performing products to support strategic decision-making and expansion prospects.
Tools: Data Visualization, Power Pivot, Excel, and Pivot Tables